NodeJs V8 CPU Profiling Not Loading Results

I am trying to use the integrated V8 Profiler for my nodejs application. I have configured the "Record CPU profiling info" selection, and I can verify that when I run my application, a log file is being created.
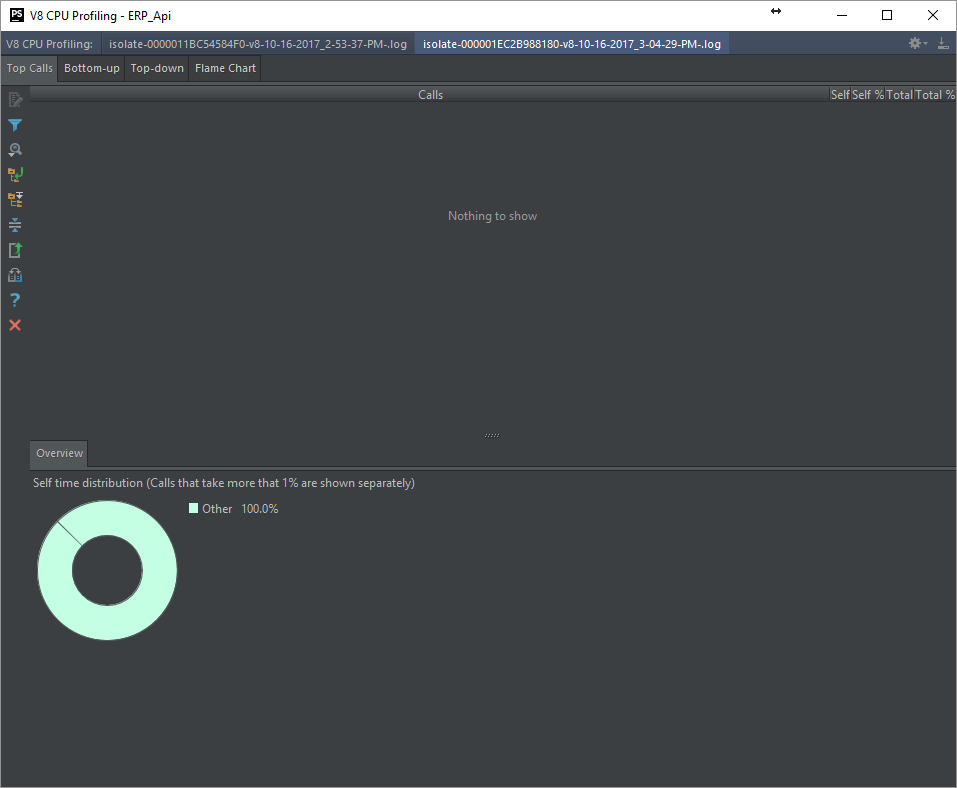
My log file is over 77MB, yet when I try to open it in the V8 CPU Profiling dialog all I see is "Nothing to show".
Here's a pic of the empty dialog. You can see that the log file is loaded in the tab at the top. And I can verify that the log file has a ton of data in it, and is over 77MB. Yet the dialog is not displaying anything:
https://www.dropbox.com/s/g82orxnxt0fxqr0/v8cpu.png?dl=0
Any thoughts?
Thanks.
Please sign in to leave a comment.
So, I left this dialog up over night.
When I came in this morning, there was data in it! Magical!
I'm guessing it was actually loading, and just takes a very long time to load. I know it sat for a least an hour yesterday with no data (I was doing other things).
So, I'm guessing this is a bug where it is missing a progress bar, or other loading status indicator.
Hello,
There were some related changes introduced to 2017.3 EAP build.
Could you, please, download and install the latest 2017.3 build from Toolbox app (<https://www.jetbrains.com/toolbox/app/>) or from https://confluence.jetbrains.com/display/PhpStorm/PhpStorm+Early+Access+Program and check if the described issues are still present there?