Cannot connect to debugger via Port Forwarding
Hi
I am running WebStorm 2017.3 EAP inside an Ubuntu Virtualbox as the CLIENT, where Windows 10 is the HOST.
The Jetbrains Chrome Debug Tool successfully connects to the IDE when I use Chrome inside Ubuntu.
But if I try to run my application on the Windows Host - I cannot get the debugger to connect to the IDE inside the Ubuntu VirtualBox.
I have set up VBox NAT port forwarding for my application and that is running well. I have also set up Port Forwarding for the debug tool .
63342 (Host) -----> 63342 (Client)
I have tried a variety of possibilities.
VirtualBox NAT port mapping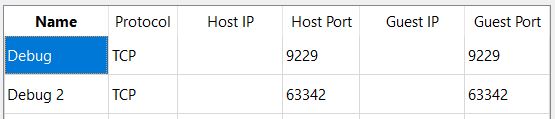
Please sign in to leave a comment.
First, let's make it clear that Chrome extension can only connect to the IDE running on localhost. You can't start Chrome on one host and make it connect to the IDE running on a different host. But you can still debug application started on a different machine by specifying URL of remote application in JavaScript Debug run configuration.
If your application is hosted on built-in webserver, and you'd like to connect to this application from a different machine, here are the instructions:
- on a remote host, make sure to install JetBrains IDE Support extension into Chrome.
- in extension options (chrome-extension://hmhgeddbohgjknpmjagkdomcpobmllji/options.html), specify the IP and port of the target machine.
- on a target computer, start WebStorm, make sure that the port specified in Settings/Build, Execution, Deployment/Debugger is the same as above and 'Can accept external connections' is on. Open your project and run your application
Note that you need to change the default port (63324) to some different one (8080, 8090) if you need to connect from external host - external connections to 63342 are not supported for security reasons
@Elena - thank you for your reply.
It seems my setup is similar to the last scenario you stated : "If your application is hosted on built-in webserver, and you'd like to connect to this application from a different machine"
I have diagrammed my setup to help explain. My MeteorJS application and IDE is running in the VBox Ubuntu client, but I am viewing the app in Chrome on the Windows Host. It is not a Remote Host setup as the application and IDE are all on the same exact machine (ubuntu). I would have thought port forwarding would have worked very nicely, but the Jetbrains IDE Support icon does not show "connected".
>It seems my setup is similar to the last scenario you stated : "If your application is hosted on built-in webserver, and you'd like to connect to this application from a different machine"
No, it's clearly not the case. Your application is served by Meteor server that is listening on port 3001. Please don't confuse the debugger port with the port your application is hosted on.
>My MeteorJS application and IDE is running in the VBox Ubuntu client, but I am viewing the app in Chrome on the Windows Host.
You can't connect Chrome running on one host to the IDE on a different host. As I wrote above, both the IDE and Chrome should be run on the same host.
BTW, if your are just viewing your app from Windows host, why do you need to get the extension connected? what are you trying to accomplish?
No am not confusing the ports. App is on 3001. Jetbrains Debugger is on 63343
> what are you trying to accomplish?
Client side debug - for example setting breakpoints in client side code
>No am not confusing the ports. App is on 3001. Jetbrains Debugger is on 63343
Yes. So it's NOT hosted on built-in webserver
>Client side debug - for example setting breakpoints in client side code
But you need setting breakpoints in IDE, and starting debug session from the IDE. What's the reason for trying to access it from Chrome running on different host using port forwarding?
If you like to debug application running on remote host, you need the following:
- install the IDE locally, create a local copy of your application, open it as a project
- set breakpoints, create a JavaScript Debug run configuration, specifying your remote web server address (like remotehost.com:3001) as URL
- debug this configuration