Javascript Debug configuration - breakpoints never hit
Hi, I've been trying for hours to get WebStorm setup to debug a local node application, with zero luck. I've at least made it to where I can launch the page via WebStorm and have it open Chrome -> Spit out console.log() statement to WebStorm, but none of my breakpoints ever get hit still.
Here's what my configuration looks like:

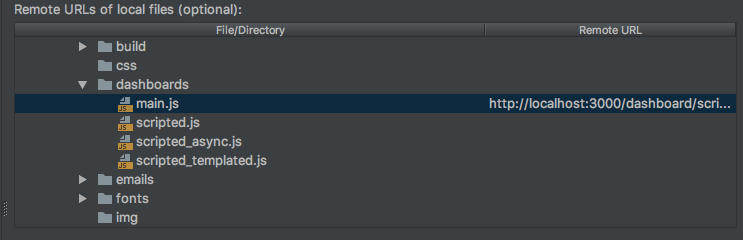
And I've even tried setting the Remote URL (the application is running locally via npm run watch):
I can navigate to the page just fine and see console output in WebStorm, but my breakpoints in "main.js" never trigger.
Please sign in to leave a comment.
What folder is your application served from (your web root dir)? Try specifying URL mappings for this folder. Your mappings do not look correct: first, you need setting them for folders, not for individual files; next, why the mapping for dashboard/main.js is `localhost:3000/dashboard/script...`? Normally the structure down from the root matches the local files structure....
I'm not exactly sure what the "web root dir" is -- but this is the project I'm trying to debug though: https://github.com/grafana/grafana
I have custom scripts in `../public/dashboards/`, one of which is the `main.js`-- however, the page to navigate to this script ends up being http://localhost:3000/dashboard/script/main.js?orgId=1
Interestingly, if I set my breakpoint in "routes.ts", webstorm actually halts and let's me debug from there. But if I resume the program, it doesn't hit the breakpoints that are stored in ../public/dashboards/main.js
The routes are:
Which then leads to:
This outputs the expected "script main.js" in the console (the :type and :slug from my URL). I'm not sure if this helps hint at why I can't debug anything in the directory I want to, but hopefully it does.
so, you can debug the frontend code itself (written in Tyoescript), but can't debug dashboard data loaded by the app? Did you check if you can debug it in Chrome dev tools?
Yes that's correct. I can't get the chrome dev tools to do anything, even in the ts
@... I have this same issue. Did you ever get your debugger working?