What could be possible breaking the application when debugging is enabled?

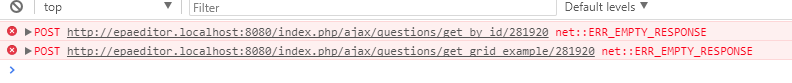
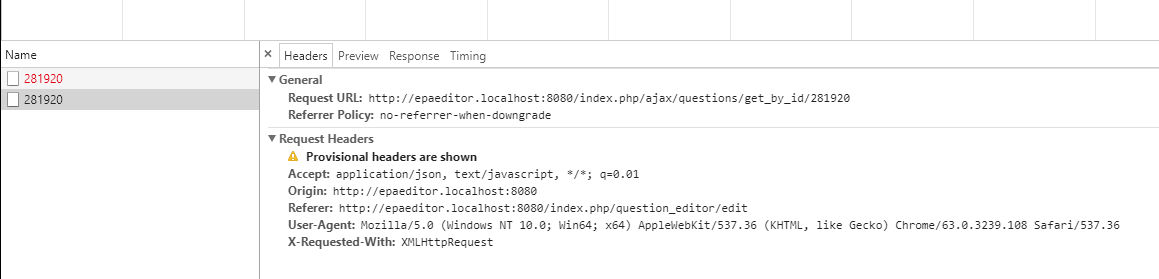
I am having a weird issue and it's the first time I have it however I am not sure what could be wrong here and I need some help. Basically as soon as I enable the debugger in the browser the application start breaking and none AJAX request is being fulfilled (see pics below).
This is the Xdebug configuration at server level:
[xdebug]
xdebug.default_enable = 1
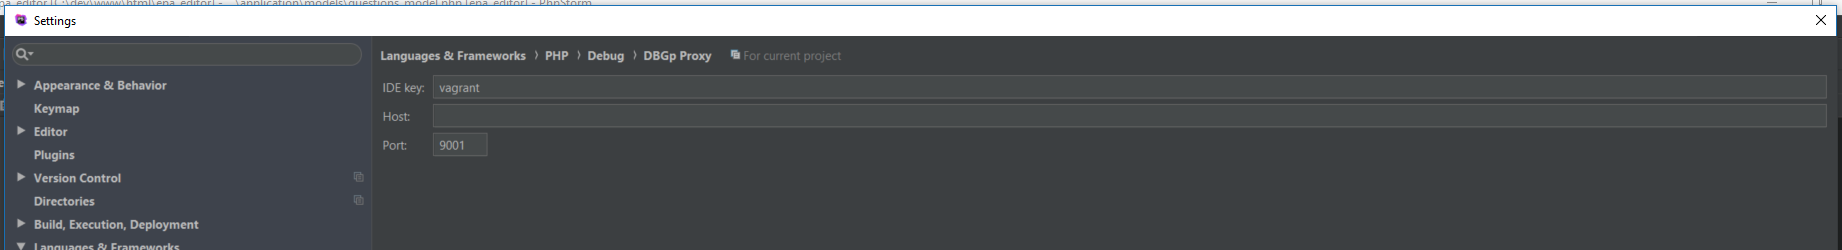
xdebug.idekey="vagrant"
xdebug.remote_enable = 1
xdebug.remote_autostart = 0
xdebug.remote_handler=dbgp
xdebug.remote_log="/var/log/xdebug/xdebug.log"
xdebug.remote_host=10.0.2.2 ; IDE-Environments IP, from vagrant box.
xdebug.var_display_max_depth = -1
xdebug.var_display_max_children = -1
xdebug.var_display_max_data = -1
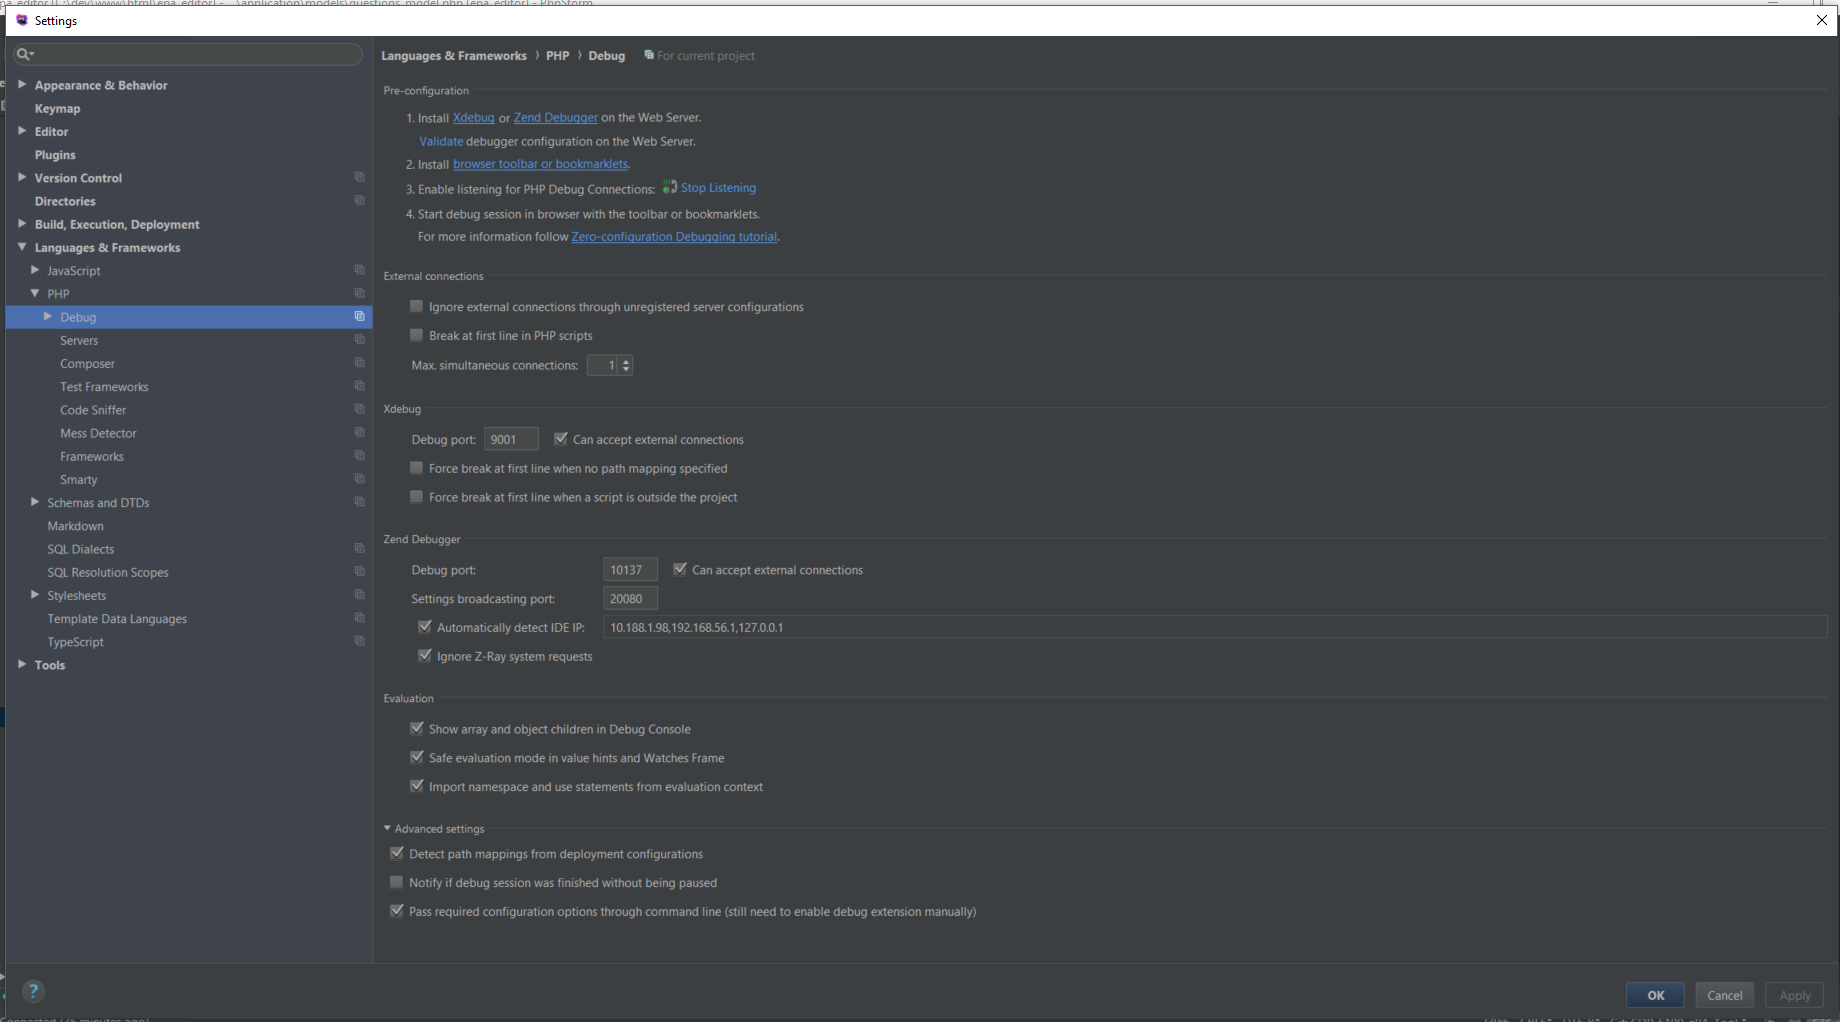
And this is how I have everything setup on the IDE:
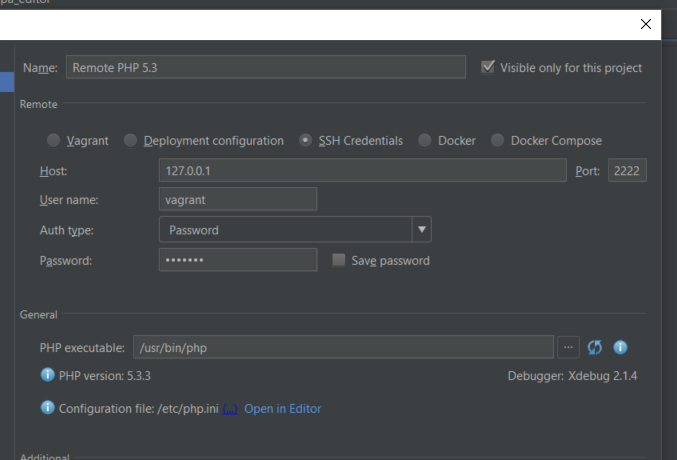
Any ideas?
Please sign in to leave a comment.
Hi there,
1. What exactly do you mean by "enable debug"?
2. What web server do you use there? How PHP is getting executed -- I mean -- is it handled by php-fpm or some another way (e.g. Apache handler if Apache is used)?
3.I see you have 9001 in PhpStorm settings for xdebug port .. but your php.ini xdebug settings do not have that port mentioned .. which means that default 9000 is used.
4. What xdebug log has to say?
Right now ... it's rather unlikely to be the port issue (e.g. xdebug connects to php-fpm as sees "go away" kind of response) -- debugging should continue. Right now it's more some crash happens...