Finding a good way to reverse engineering or trace cod
Hi.
I'm pretty new to IntelliJ. I was always wondering if there is something like that I describe below:
I'm looking for a tool that will write or display diagram or anything else of functions that I'm invoking. Let's say I have an application combined with a device that does something, for example it's scanning a barcode. I have all programmed and when I scan application prints me that code on the console. However this application is far more complex than this - there are plenty of things done from the scanning to printing result. The device can do plenty of more things. And is there anyway to trace it because I don't know the code very well and documentation it's not in English.
Whan I mean is:
1. When any method is invoked in application show trace of it (if possible diagram) of what was from the beggining to the end invoked (of course I only want to display project methods).
If there is no such thing what's the best way to know the code of quite large application without knowing it - I've just have it up and running.
It can be usefull for everything - like when you do a web page and this webpage invoke something in your app display trace of it.
I don't know if I desribed it clearly enough - so ask any question I will try to describe it better.
p.s. sorry for language mistakes - spelling inspection does not work in there.
Please sign in to leave a comment.
Hello Gal,
No, there's no such possibility, like "total tracing"
I'm afraid in case you get the trace you want, it would be difficult to get use of it: there would be tonns of method calls, possibly from different threads.
What you can do with IntelliJ IDEA for reverse engineering is, for selected set of methods:
- Navigate -> Call Hierarchy action (you're provided with the method call tree)
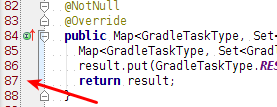
- Also, you can create debugger breakpoints with "Suspend=no" and "Log evaluated expression"
Hi Irina,
Yes. I though there will be no such tool - about calling plenty of classes, etc. you could always provide some kind of skipping, like in debugger (javax.*).
Sorry - I'm very new to Intellij - can you provide me an further explenation or link for HowTo??
Hello,
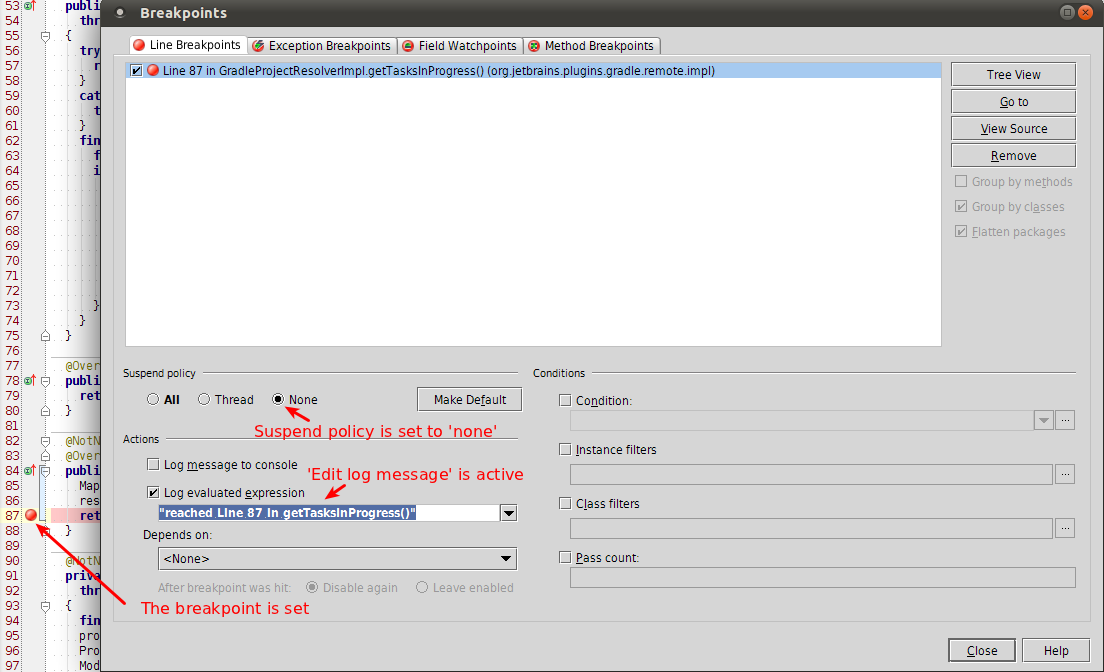
Please check this reference page for the available breakpoint options.
Hint: you can left-click on the editor gutter holding shift. That is a shortcut for setting no-suspend breakpoint and starting configuring its message:
Regards, Denis