PHPStorm6 and XDebug

Hi,


I have a promblem, that debugging is not possible.


Please see my configs and tell me how to start XDebug working with PHPStorm6.


I'm running on Windows7 64 / nginx / php-cgi 5.3.22


PHP 5.3.22 (cli) (built: Feb 20 2013 17:30:55)
Copyright (c) 1997-2013 The PHP Group
Zend Engine v2.3.0, Copyright (c) 1998-2013 Zend Technologies
    with Xdebug v2.2.1, Copyright (c) 2002-2012, by Derick Rethans


nginx conf:
...

fastcgi_pass   127.0.0.1:9009;

...


all my PHP scripts work fine.


Now XDebug


php.ini


[XDebug]
zend_extension = D:\WWW\PHP\ext\php_xdebug-2.2.1-5.3-vc9-nts.dll
xdebug.remote_enabled=1
xdebug.overload_var_dump=1
xdebug.var_display_max_depth=20
xdebug.var_display_max_data=4096
xdebug.var_display_max_children=4096
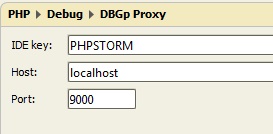
xdebug.remote_host=localhost
xdebug.remote_port=9000
xdebug.idekey="PHPSTORM"
xdebug.remote_handler=dbgp
xdebug.remote_autostart=1


I have read this article: http://confluence.jetbrains.com/display/PhpStorm/Zero-configuration+Web+Application+Debugging+with+Xdebug+and+PhpStorm
and simple start PhpStorm6 and press "Start Listen PHP Debug Connections"

Then, I setup COOKIE for my webpagin throug your bookmarklet (in Firebug I see, that this cookie is sent to server)

Cookie PHPSESSID=hg63fc5e6j772mje5f02ou5c14; XDEBUG_SESSION=PHPSTORM


I set breakpoint in my script, but nothing happened.
Nothing like "The “Incoming Connection” dialog should appear automatically."


How to know, what should I do?

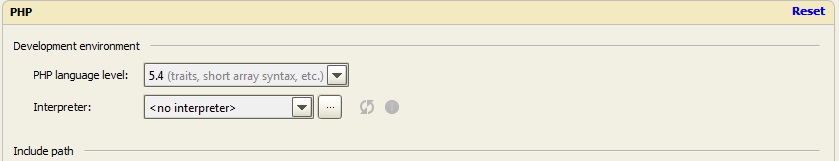
Screenshot from PhpStorm Configuration:

Attachment(s):
s4.jpg
s3.jpg
s2.jpg
s1.jpg
0
4 comments

Hi Maxim,

As I understand you have everything running on your Windows computer (no remote/virtual server) -- is this correct?

I've never worked with nginx, so not so sure about all of this. Any way

  1. If you do not know what Xdebug / DGBp Proxy is, then do not configure it -- it is used to allow simultaneous debugging on remote host by multiple developers from *different IPs* when xdebug.remote_connect_back cannot be used + it requires proxy software (script) to be running. Maybe this interfere with what you are doing.
  2. I suggest deleting your entry at "Settings | PHP | Servers" (although it's unlikely to be the issue here) -- PhpStorm will help you creating new one when debug connection will be established and no such entry created yet. This also will help with setting up correct path mappings if required
  3. You should not need any cookie / bookmarklet when you have xdebug.remote_autostart=1. In any case -- I recommend disabling this option (= 0) as sometimes (for some users -- often) it causing issues -- better use bookmarklet / browser extension for initiating debug session.

  4. When you click "Run | Start listen PHP Debug Connections" -- check if PhpStorm is the one who actually listen on that 9000 port (maybe you have another app instead). You can do this via your firewall app / tcpview from Microsoft / standard netstat (with specific options)
0
Avatar
Permanently deleted user

> As I understand you have everything running on your Windows computer (no remote/virtual server) -- is this correct?

yes. Local Win7 64 machine.

  1. If you do not know what Xdebug / DGBp Proxy is, then do not configure it -- it is used to allow simultaneous debugging on remote host by multiple developers from *different IPs* when xdebug.remote_connect_back cannot be used + it requires proxy software (script) to be running. Maybe this interfere with what you are doing.

xdebug

xdebug support enabled
Version 2.2.1
IDE Key PHPSTORM

Supported protocols Revision
DBGp - Common DeBuGger Protocol $Revision: 1.145 $

Directive Local Value Master Value
xdebug.auto_trace Off Off
xdebug.cli_color 0 0
xdebug.collect_assignments Off Off
xdebug.collect_includes On On
xdebug.collect_params 0 0
xdebug.collect_return Off Off
xdebug.collect_vars Off Off
xdebug.coverage_enable On On
xdebug.default_enable On On
xdebug.dump.COOKIE no value no value
xdebug.dump.ENV no value no value
xdebug.dump.FILES no value no value
xdebug.dump.GET no value no value
xdebug.dump.POST no value no value
xdebug.dump.REQUEST no value no value
xdebug.dump.SERVER no value no value
xdebug.dump.SESSION no value no value
xdebug.dump_globals On On
xdebug.dump_once On On
xdebug.dump_undefined Off Off
xdebug.extended_info On On
xdebug.file_link_format no value no value
xdebug.idekey no value no value
xdebug.max_nesting_level 100 100
xdebug.overload_var_dump On On
xdebug.profiler_aggregate Off Off
xdebug.profiler_append Off Off
xdebug.profiler_enable Off Off
xdebug.profiler_enable_trigger Off Off
xdebug.profiler_output_dir \ \
xdebug.profiler_output_name cachegrind.out.%p cachegrind.out.%p
xdebug.remote_autostart Off Off
xdebug.remote_connect_back Off Off
xdebug.remote_cookie_expire_time 3600 3600
xdebug.remote_enable Off Off
xdebug.remote_handler dbgp dbgp
xdebug.remote_host localhost localhost
xdebug.remote_log no value no value
xdebug.remote_mode req req
xdebug.remote_port 9000 9000
xdebug.scream Off Off
xdebug.show_exception_trace Off Off
xdebug.show_local_vars Off Off
xdebug.show_mem_delta Off Off
xdebug.trace_enable_trigger Off Off
xdebug.trace_format 0 0
xdebug.trace_options 0 0
xdebug.trace_output_dir \ \
xdebug.trace_output_name trace.%c trace.%c
xdebug.var_display_max_children 4096 4096
xdebug.var_display_max_data 4096 4096
xdebug.var_display_max_depth 20 20

  1. I suggest deleting your entry at "Settings | PHP | Servers" (although it's unlikely to be the issue here) -- PhpStorm will help you creating new one when debug connection will be established and no such entry created yet. This also will help with setting up correct path mappings if required

Nothing happened. :(

You should not need any cookie / bookmarklet when you have xdebug.remote_autostart=1. In any case -- I recommend disabling this option (= 0) as sometimes (for some users -- often) it causing issues -- better use bookmarklet / browser extension for initiating debug session.


Autostart is disabled with no changes.

  1. When you click "Run | Start listen PHP Debug Connections" -- check if PhpStorm is the one who actually listen on that 9000 port (maybe you have another app instead). You can do this via your firewall app / tcpview from Microsoft / standard netstat (with specific options)

PHPStorm is the one who actually listen 9000 port. See attach from tcpview.

I've restared all: nginx, php-cgi, phpstorm many times with no changes.
PHPStorm doesn't offer me any dialog window to start debug, and it doesn't stop at any breakpoint


Attachment(s):
t2.jpg
t1.jpg
0

Hi Maxim,

  1. xdebug.remote_enable must be enabled (set to 1 / On)
  2. Just in case -- try xdebug.remote_host = 127.0.0.1 (that's in case PHP/Windows will prefer IPv6 over IPv4 when resolving localhost)
  3. Try the "Zero conf debugging" manual again
  4. Double check from actual PHP script (not dummy one, but real page) that correct xdebug cookie is actually passed -- maybe your nginx (or whatever) drops it somehow (quite unlikely, but still)
  5. If still nothing -- enable xdebug logging ( http://xdebug.org/docs/all_settings#remote_log ) and see what xdebug thinks about all of this.
    • If log is empty -- make sure that php can write to that file.
    • If still empty -- then xdebug simply does not see start debug session command for whatever reason
    • If there is some text -- see what it says .. and collect debug log from phpStorm side as well: http://devnet.jetbrains.com/docs/DOC-1202

PHPStorm doesn't offer me any dialog window to start debug

That simply means that it does not receive xdebug connection (xdebug is the one who creates connection to IDE not other way around)

0
Avatar
Permanently deleted user

xdebug.remote_enable must be enabled (set to 1 / On)

Thanks. In php.ini was xdebug.remote_enabled=1
Now it works!

0

Please sign in to leave a comment.