Connecting to Remote Server using SSH to run Xdebug
I have been trying to follow this guide so I can debug a remote debian 8 box running nginx
https://confluence.jetbrains.com/display/PhpStorm/Remote+debugging+in+PhpStorm+via+SSH+tunnel
You can see my php.ini here:
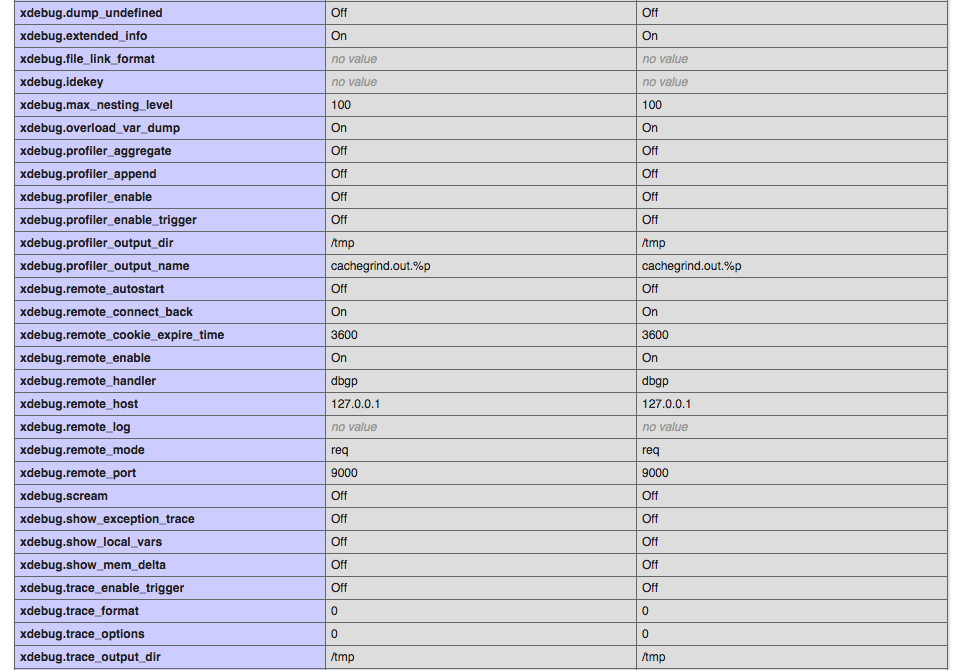

I think my php.ini is fine.
I start the 
Then to create the tunnel on OSX:
ssh -R 9000:localhost:9000 user@remotehostip
That works fine.
Then I go to my webpage and use bookmarklets which append ?XDEBUG_SESSION='PHPSTORM' and nothing happens I tried also using xdebug.remote_connect_back = 1 to just use the connecting ip instead of the tunnel and still nothing.
I have made user to restart php_fastcgi after every php.ini change (thus why they show in screenshots)
Anyone know how I can debug this any better?
Please sign in to leave a comment.
Hi there,
xdebug.remote_connect_back should definitely be off / 0 (zero).
Please collect xdebug logs: http://xdebug.org/docs/all_settings#remote_log for such debugging attempt. It's possible that local firewall still blocks you from accepting incoming debug connection .. or port is occupied by another app.
Similar recent question at StackOverflow: http://stackoverflow.com/a/33401627/783119 -- you can try connecting to PhpStorm using telnet to see if tunnel is working/PhpStorm is listening.
Thanks Andriy will change xdebug.remote_connect_back to 0, reload the php.ini and get you those logs.
So I set xdebug.remote_log = "/tmp/xdebuglogs.log" in php.ini then restart php.
Tried going to webpage and launching debugging via applet but nothing gets written to the log.
Is there anything else I need to turn on in php.ini get logs working?
Either try
Any better now?
Log opened at 2015-10-29 20:19:36
I: Connecting to configured address/port: 127.0.0.1:9000.
I: Connected to client. :-)
-> <init xmlns="urn:debugger_protocol_v1" xmlns:xdebug="http://xdebug.org/dbgp/xdebug" fileuri="file:///var/www/html/ip_app/ip_app.php" language="PHP" protocol_version="1.0" appid="19376" idekey="PHPSTORM"><engine version="2.2.5"><![CDATA[Xdebug]]></engine><author><![CDATA[Derick Rethans]]></author><url><![CDATA[http://xdebug.org]]></url><copyright><![CDATA[Copyright (c) 2002-2014 by Derick Rethans]]></copyright></init>
-> <response xmlns="urn:debugger_protocol_v1" xmlns:xdebug="http://xdebug.org/dbgp/xdebug" status="stopping" reason="ok"></response>
Log closed at 2015-10-29 20:19:36
Log opened at 2015-10-29 20:19:36
I: Connecting to configured address/port: 127.0.0.1:9000.
I: Connected to client. :-)
So .. I assume it's all working now -- it seems to be able to connect somewhere (there is no indication what software has responded on that port, unfortunately)
When I manullay drop ?XDEBUG_SESSION_START=PHPSTORM it writes to the error log but debugging doesn't work.

It doesn't bring up the phpstorm program like it should. I have breakpoints set. But nothing seems to happens.
Like you, I think from that log it should work but it doesn't. 9000 is the default port right? Where can I set or check this setting in PHPSTORM?
Should this be set to 9000? Since I use ssh -R 9000:localhost:9000 user@remoteip port 9000 is taken, how should I set this up properly?
1) Which "error log"? I assume you are talking about xdebug log (which is ordinary log).
2) If you drop ?XDEBUG_SESSION_START=PHPSTORM then what other options you have set or used for xdebug to try to debug?
Yes.
Settings/Preferences screen has quick search box (top left corner) -- you can use it to narrow your search.
Should be in "PHP | Debug"
---
If you exit PhpStorm but still have SSH tunnel working -- will xdebug log have the same info or different?
If you launch PhpStorm but not activate any debug session (or "phone handle" icon) -- will log contain the same info (connection successful)?
I found PHP|Settings and I see you cannot have the built-in server use port 9000 obviously

Yes -- that extremely likely would be the reason.
You should not change built-in web server port -- especially to xdebug's 9000. Better leave it at default 63342. But xdebug's one you can change -- I just see no reason for that -- it should match port used in SSH tunnel so leave xdebug at 9000.
That port has priority over xdebug (simply because IDE binds it when it starts while xdebug port only when needed). Plus, on Mac, for some reason, IDE does not report that xdebug port is already occupied.
Just to clarify:
1) Which "error log"? I assume you are talking about xdebug log (which is ordinary log).
Yes that's right just the ordinary error log.
2) If you drop ?XDEBUG_SESSION_START=PHPSTORM then what other options you have set or used for xdebug to try to debug?
[xdebug]
zend_extension="/usr/lib/php5/20131226/xdebug.so"
xdebug.remote_enable=1
xdebug.remote_host=127.0.0.1
xdebug.remote_port=9000
xdebug.remote_log="/tmp/xdebuglogs.log"
xdebug.idekey=PHPSTORM
If you exit PhpStorm but still have SSH tunnel working -- will xdebug log have the same info or different?
Same info it prints this three times:
Log closed at 2015-10-30 13:00:52
Log opened at 2015-10-30 13:00:52
I: Connecting to configured address/port: 127.0.0.1:9000.
I: Connected to client. :-)
-> <init xmlns="urn:debugger_protocol_v1" xmlns:xdebug="http://xdebug.org/dbgp/xdebug" fileuri="file:///var/www/html/ip_app/checkIP.php" language="PHP" protocol_version="1.0" appid="19480" idekey="PHPSTORM"><engine version="2.2.5"><![CDATA[Xdebug]]></engine><author><![CDATA[Derick Rethans]]></author><url><![CDATA[http://xdebug.org]]></url><copyright><![CDATA[Copyright (c) 2002-2014 by Derick Rethans]]></copyright></init>
-> <response xmlns="urn:debugger_protocol_v1" xmlns:xdebug="http://xdebug.org/dbgp/xdebug" status="stopping" reason="ok"></response>
Log closed at 2015-10-30 13:00:52
If you launch PhpStorm but not activate any debug session (or "phone handle" icon) -- will log contain the same info (connection successful)?
Yes I get this three times:
Log opened at 2015-10-30 13:04:09
I: Connecting to configured address/port: 127.0.0.1:9000.
I: Connected to client. :-)
-> <init xmlns="urn:debugger_protocol_v1" xmlns:xdebug="http://xdebug.org/dbgp/xdebug" fileuri="file:///var/www/html/ip_app/checkIP.php" language="PHP" protocol_version="1.0" appid="19480" idekey="PHPSTORM"><engine version="2.2.5"><![CDATA[Xdebug]]></engine><author><![CDATA[Derick Rethans]]></author><url><![CDATA[http://xdebug.org]]></url><copyright><![CDATA[Copyright (c) 2002-2014 by Derick Rethans]]></copyright></init>
-> <response xmlns="urn:debugger_protocol_v1" xmlns:xdebug="http://xdebug.org/dbgp/xdebug" status="stopping" reason="ok"></response>
Log closed at 2015-10-30 13:04:09
Ya I figured as much and already changed as you requested.
By this I meant anything like in my 2nd post .. or xdebug cookie/bookmarklet (so that it does not depends on actual query parameter)
Even with PhpStorm closed? That's odd.
Can you check with netstat (or lsof -- something like "sudo lsof -nP -iTCP -sTCP:LISTEN") what app has that port opened?
Also -- have you tried connecting from remote to local via telnet? What kind of response did you got?
I hope you have restarted IDe after changing built-in server port (at leasts here on Windows it needs restart)
Also, do you have PHP/xdebug installed locally? Can you test that you can debug simple local CLI scripts (require no server). Maybe it's local firewall?
As you can see the person in SO question was more lucky / had better setup?
Just as a review of my steps:
Log opened at 2015-10-30 13:14:28
I: Connecting to configured address/port: 127.0.0.1:9000.
I: Connected to client. :-)
-> <init xmlns="urn:debugger_protocol_v1" xmlns:xdebug="http://xdebug.org/dbgp/xdebug" fileuri="file:///var/www/html/ip_app/phpinfo.php" language="PHP" protocol_version="1.0" appid="19481" idekey="PHPSTORM"><engine version="2.2.5"><![CDATA[Xdebug]]></engine><author><![CDATA[Derick Rethans]]></author><url><![CDATA[http://xdebug.org]]></url><copyright><![CDATA[Copyright (c) 2002-2014 by Derick Rethans]]></copyright></init>
-> <response xmlns="urn:debugger_protocol_v1" xmlns:xdebug="http://xdebug.org/dbgp/xdebug" status="stopping" reason="ok"></response>
Log closed at 2015-10-30 13:14:28
for basically anything I do. The reason it was showing it 3 times was because it was debugging a php file that is receiving an ajax call. When I switched to a file just containing <?php phpinfo() ?> it shows only one iteration in the debug log.
Overall it looks OK (your steps).
Here is the original article which was used to create that tutorial: http://derickrethans.nl/debugging-with-xdebug-and-firewalls.html
Don't know what else could be done here - may only suggest restarting both local and remote to cleanup any possible glitches...
By this I meant anything like in my 2nd post .. or xdebug cookie/bookmarklet (so that it does not depends on actual query parameter)

Ya tried both and they don't even register an entry in the log.
Even with PhpStorm closed? That's odd.
Can you check with netstat (or lsof -- something like "sudo lsof -nP -iTCP -sTCP:LISTEN") what app has that port opened?
Also -- have you tried connecting from remote to local via telnet? What kind of response did you got?
I will try this to find out. So maybe something on my server is using port 9000? But would I be able to make a ssh tunnel is that was the case?
I hope you have restarted IDe after changing built-in server port (at leasts here on Windows it needs restart)
Yes.
Also, do you have PHP/xdebug installed locally? Can you test that you can debug simple local CLI scripts (require no server). Maybe it's local firewall?
No I don't but guess I can. I don't have any firewalls up but once again if I did I shouldn't be able to create the ssh tunnel I am using right?
As you can see the person in SO question was more lucky / had better setup?
Read once but can read again to see if there is anything helpful.
sudo lsof -nP -iTCP -sTCP:LISTEN
...
php5-cgi 2703 www-data 0u IPv4 11805 0t0 TCP 127.0.0.1:9000 (LISTEN)
php5-cgi 2705 www-data 0u IPv4 11805 0t0 TCP 127.0.0.1:9000 (LISTEN)
php5-cgi 2709 www-data 0u IPv4 11805 0t0 TCP 127.0.0.1:9000 (LISTEN)
php5-cgi 2710 www-data 0u IPv4 11805 0t0 TCP 127.0.0.1:9000 (LISTEN)
php5-cgi 2714 www-data 0u IPv4 11805 0t0 TCP 127.0.0.1:9000 (LISTEN)
php5-cgi 2715 www-data 0u IPv4 11805 0t0 TCP 127.0.0.1:9000 (LISTEN)
mysqld 3054 mysql 10u IPv4 12121 0t0 TCP 127.0.0.1:3306 (LISTEN)
exim4 3448 Debian-exim 4u IPv4 12750 0t0 TCP 127.0.0.1:25 (LISTEN)
exim4 3448 Debian-exim 5u IPv6 12751 0t0 TCP [::1]:25 (LISTEN)
sshd 3506 jj 8u IPv6 13115 0t0 TCP [::1]:9000 (LISTEN)
...
Where did you run it (cannot say it myself based on info)? It meant to be on your local Mac.
The idea is to see who has TCP 9000 port open.
Since I'm not Mac/Linux user .. I'm not familiar with all those columns (what is which) so cannot tell this for sure. But I suggest to kill all those processes that have TCP 9000 port opened and try again (activate "phone handle" icon) -- the owner of such binding shoul dbe phpstorm app. Righ now it looks like it's a web server.
So I switched 9000 to 9001 in my ssh tunnel and ini php.ini file.
php5-cgi 3678 www-data 0u IPv4 15405 0t0 TCP 127.0.0.1:9000 (LISTEN)
php5-cgi 3680 www-data 0u IPv4 15405 0t0 TCP 127.0.0.1:9000 (LISTEN)
php5-cgi 3681 www-data 0u IPv4 15405 0t0 TCP 127.0.0.1:9000 (LISTEN)
php5-cgi 3682 www-data 0u IPv4 15405 0t0 TCP 127.0.0.1:9000 (LISTEN)
php5-cgi 3683 www-data 0u IPv4 15405 0t0 TCP 127.0.0.1:9000 (LISTEN)
php5-cgi 3684 www-data 0u IPv4 15405 0t0 TCP 127.0.0.1:9000 (LISTEN)
php5-cgi 3685 www-data 0u IPv4 15405 0t0 TCP 127.0.0.1:9000 (LISTEN)
My php5 is using port 9000 to listen so it can't be used to debug. Since this is nginx not apapche the php5-cgi I guess talkes to nginx on port 9000?
Anyway I really appreciate all your help.
It could be... but it's very unusual choice to use standard xdebug port for such communications.
Since you are switching to 9001 .. make sure you do this in PhpStorm as well (better to use the same port number to avoid confusion IMO -- why 9000 here and 9001 there, unless, of course, you definitely know what goes where)
nginx is Russian so maybe they do it different in the "Mother Land" LOL

But fastcgi does indeed listen by default on localhost port 9000.
As a side not do you have any idea why the phpstorm bookmarklets may not work for me? I have to manually drop in ?XDEBUG_START_SESSION=PHPSTORM every time I want to debug.
And thanks so much your help couldn't have done it without you!
They seem to work OK (tested few days ago in Chrome & IE).
I'm just using browser extension for that -- there are some for Firefox/Chrome/Opera for sure -- just search for "xdebug" or "xdebug helper" (or just visit https://confluence.jetbrains.com/display/PhpStorm/Browser+Debugging+Extensions )
I ran into a problem trying to execute scripts from the shell/cli access. I hadn't even set anything up in the project for a web server and was trying to use an interpreter on an AWS EC2 instance to actually execute the code.
From near as what i could see, when I had the ssh connection set up, PhpStorm was trying to connect on port 9000 directly to the EC2 address. The stinger is, it couldn't make the trip back to my IP because I am behind a NAT and I have no control over any port forwarding across it. I have a vagrant set up that I was eventual able to get working by forwarding the xdebug port, but the ssh connection to the vagrant box just uses 127.0.0.1 on port 2222. Guessing that a similar configuration might work, I got an idea.
In both cases, I was using a RemoteForward for the xdebug port (9000) via a separate shell invoked (independent) ssh connection. What I ended up doing is adding an additional Localforward of the local port 10022 to the remote's ssh (22) port. Then I configured the ssh interpreter tunnel in PhpStorm to use 127.0.0.1:10022 instead of the EC2 IP on port 22. (tunneling PhpStorm ssh connection through the shell php connection)
The result was that PhpStorm then tried using 127.0.0.1 for the xdebug port and the remote end responded back to it's 127.0.0.1 and the xdebug exchange works in-so-long as the ssh tunnel is open.
btw, it should be noted that the above method also works on ProxyCommand forwarded ssh tunnels. (where to connect to a remote ssh behind a firewall or nat, you have to connect first to another ssh server with an exposed port)
It can also be used with more than one server by changing what host you are tunneling to. If the files/basic-php-configuration are the same or similar, you don't have to change any settings in phpstorm. Just change where the the tunnel points to.