Object inspector in the debugger hangs
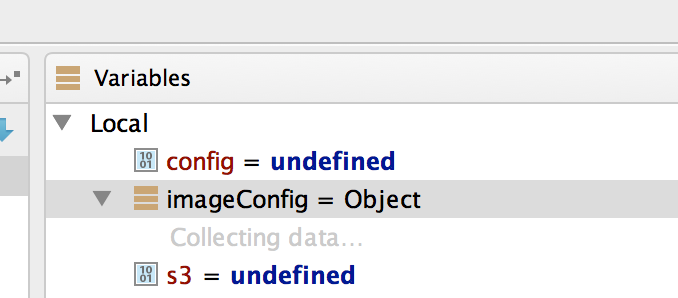
When stopping at a breakpoint while debugging a node (v0.10.16) expressjs app in WebStorm 7 Beta, drilling in to an Object in the inspector rarely works.
Clicking the arrow to exapnd the object hangs with "Collecting data". This happens all over the place and seems unrelated to the objects or breakpoints themselves.
evaluating console.log(<object>) usually produces useful output though.
Thoughts?
Attachment(s):
collecting-data.png
Please sign in to leave a comment.
Hello!
What is your WebStorm build number? Also, please, can you attach your idea.log?
Thanks,
Lena
Build nr: 131.48
The log is attached.
Attachment(s):
idea.log.zip
Thanks!
Does the problem occur each time you debug your application? For example, can you restart WebStorm and the start the debugging - does the p[roblem persist? If yes, can you check if it's specific to your application (for example, can it be recreated with the node.js express project created by template)?
also, please, can you turn on debug logging for the categories listed below, recreate the problem and attach the updated idea.log?
<category name="#org.jetbrains.io.jsonRpc.JsonRpcServer">
<priority value="DEBUG"/>
</category>
<category name="#org.jetbrains.v8.EventMap">
<priority value="DEBUG"/>
</category>
<category name="#org.jetbrains.v8.AfterCompileProcessor">
<priority value="DEBUG"/>
</category>
<category name="#org.jetbrains.v8.connection.V8MessageDecoder">
<priority value="DEBUG"/>
</category>
<category name="#org.jetbrains.rpc.MessageManager">
<priority value="DEBUG"/>
</category>
<category name="#org.jetbrains.io.ChannelExceptionHandler">
<priority value="DEBUG"/>
</category>
See http://devnet.jetbrains.com/docs/DOC-1202 for instructions
Here's the debug log..
Attachment(s):
idea.log.zip
Only in this project or in any project (even simple)? Is it occurs for any object or only for several (like imageConfig)? Could you try to wait, for example, 60 or 120 seconds? Does it work in wathes or in "evaluate expression" (see Run app menu)?
It appears in several Node projects. All my projects use express.js though. Adding the object to watches makes no difference. Evaluating expression doesn't help either.
I have let it wait over lunch once. When I came back it was still "Collecting data".
Another clue. When I click the little error to expand the object in the inspector, I immediately get a NPE in the WebStorm notification panel:
8:19:50 AM NullPointerException: null
>NullPointerException: null
known issue, http://youtrack.jetbrains.com/issue/IDEA-113175. Unfortunately this exception has no relation to your problem:(
Hi,
Any progress on this? I upgraded to 131.130 and the problem persists. I would consider this a blocker.
Regards,
- Torsten
Probably my private email was not received — is it possible to use Chrome RDP to remote investigation? Contact me (europe, tomorrow): gtalk/jabber develar@gmail.com or skype: develar.
The problem doesn't exist in Intellij Idea. Running my Node app in Cardea 132.425 and the debugger works fine.
I guess this is my workaround ;)
- Torsten
Workaround: Serttings -> Debugger -> JavaScript -> check "Show function values" (in your case it is unchecked now).