Help With XDebug and PHPStorm
Hello,
Sorry my first post is one of need.
I downloaded PHPStorm today for the first time. It's only the 30 day trial version.
I'm using Windows 7 64.
I was having issues getting any sort of debug connection working locally, I have both PHPStorm and Apache on the same machine so all localhost here. So I uninstalled apache + php + mysql and started off with a fresh xampp install.
I simply created a new project and added a simple index.php file in it which is a couple directories down my web root.
webroot/a/b/index.php
I can run the file perfectly fine, just no debug connections for the life of me.
I opened php.ini and modified the specified XDebug options. Here is my phpinfo output for it.
xdebug
xdebug support => enabled
Version => 2.1.1
Supported protocols => Revision
DBGp - Common DeBuGger Protocol => $Revision: 1.145 $
Directive => Local Value => Master Value
xdebug.auto_trace => Off => Off
xdebug.collect_assignments => Off => Off
xdebug.collect_includes => On => On
xdebug.collect_params => 0 => 0
xdebug.collect_return => Off => Off
xdebug.collect_vars => Off => Off
xdebug.default_enable => On => On
xdebug.dump.COOKIE => no value => no value
xdebug.dump.ENV => no value => no value
xdebug.dump.FILES => no value => no value
xdebug.dump.GET => no value => no value
xdebug.dump.POST => no value => no value
xdebug.dump.REQUEST => no value => no value
xdebug.dump.SERVER => no value => no value
xdebug.dump.SESSION => no value => no value
xdebug.dump_globals => On => On
xdebug.dump_once => On => On
xdebug.dump_undefined => Off => Off
xdebug.extended_info => On => On
xdebug.file_link_format => no value => no value
xdebug.idekey => drox => no value
xdebug.manual_url => http://www.php.net => http://www.php.net
xdebug.max_nesting_level => 100 => 100
xdebug.overload_var_dump => On => On
xdebug.profiler_aggregate => Off => Off
xdebug.profiler_append => Off => Off
xdebug.profiler_enable => Off => Off
xdebug.profiler_enable_trigger => Off => Off
xdebug.profiler_output_dir => C:\Drox\xampp\tmp => C:\Drox\xampp\tmp
xdebug.profiler_output_name => xdebug_profile.%R::%u => xdebug_profile.%R::%u
xdebug.remote_autostart => On => On
xdebug.remote_connect_back => Off => Off
xdebug.remote_cookie_expire_time => 3600 => 3600
xdebug.remote_enable => On => On
xdebug.remote_handler => dbgp => dbgp
xdebug.remote_host => localhost => localhost
xdebug.remote_log => C:\Drox\xampp\tmp => C:\Drox\xampp\tmp
xdebug.remote_mode => req => req
xdebug.remote_port => 9002 => 9002
xdebug.scream => Off => Off
xdebug.show_exception_trace => Off => Off
xdebug.show_local_vars => Off => Off
xdebug.show_mem_delta => Off => Off
xdebug.trace_format => 0 => 0
xdebug.trace_options => 0 => 0
xdebug.trace_output_dir => C:\Drox\xampp\tmp => C:\Drox\xampp\tmp
xdebug.trace_output_name => trace.%c => trace.%c
xdebug.var_display_max_children => 128 => 128
xdebug.var_display_max_data => 512 => 512
xdebug.var_display_max_depth => 3 => 3
Here is my server settings...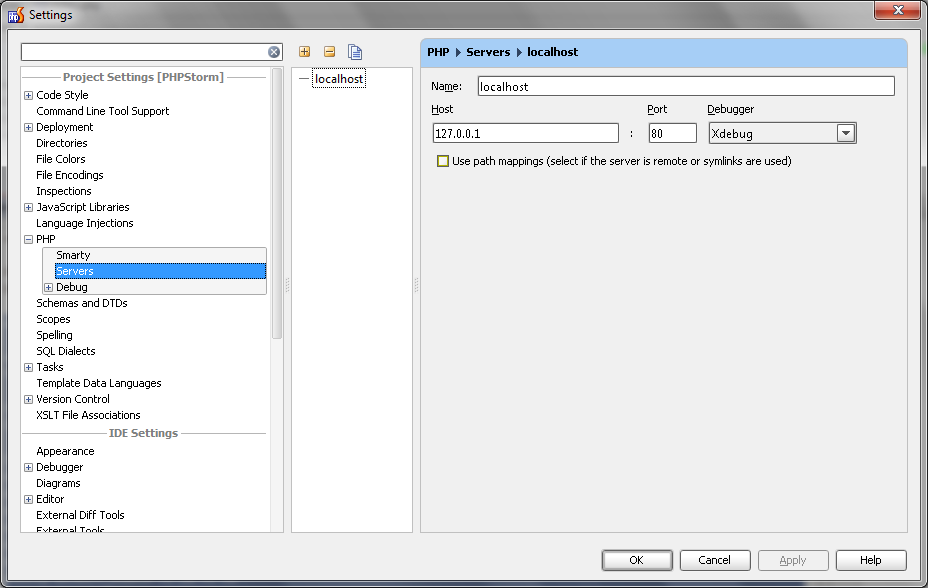
Here is my debug config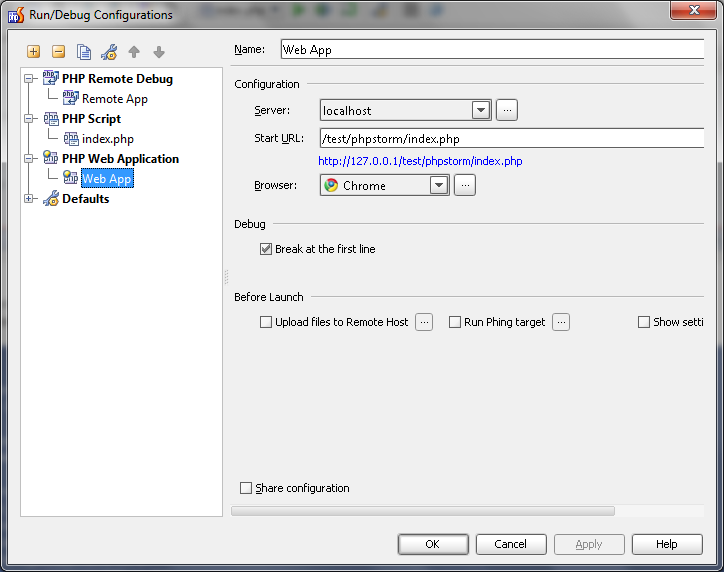
Does anyone have any suggestions?
I disabled my firewall completly to see if that was it, but no luck.
Thank you for your time
Please sign in to leave a comment.
Hello Drox,
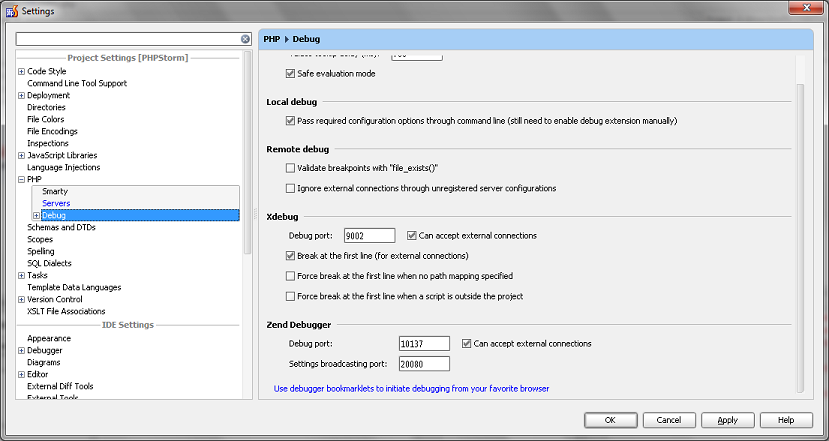
Have you set the same port number for Xdebug in the IDE settings (Project Settings | PHP | Debug)?
Thank you for feedback!
Yep, I did it because some windows service is currently hogging 9000.
One thing that's weird I noticed, my local and master idekeys are different no matter what I do.
local = drox
master = phpstorm
I changed the idekey in my debug config for remote... but no avil it never changes.
I also just tried installing the chrome extension to enable XDebug sessions for URI's.
Here is my php -> debug
Drox,
Could you please provide your xdebug log (http://xdebug.org/docs/remote#remote_log)?
Thank you for feedback!
Hi Nikolay,
Sorry for the late response. I actually had to reinstall windows 7 and that solved the issue whatever it was. PHPStorm is now fully operational!
Thanks