Xampp - breakpoints not working

I have created a new project and cannot make any breakpoints work.
The virtual server on my localhost is named mydomain.local. So the address http://mydomain.local opens the php application. When creating a new project from existing sources, I chose the first option from the wizard, which is for the case when the source files are directly in the web root folder. So I think the wizard took care of the Deployment settings and they look correct to me (the local path and project url are correct). Then I configured manually the Run/Debug configuration. However, I can't make the breakpoints work and I can't check how it was in my previous project because it is deleted.. (previous project had no problems with php debugging)
My test: I opened http://mydomain.local/index.php in editor and introduced a small bug on one line, then debugged it. There was a php error. Then I corrected the bug and set breakpoints at this line and lines surrounding it, just to be sure and chose "Debug mydomain.local". The debugger didn't stop on these breakpoints and opened the page normally. The console says "Waiting for incoming connection with ide key xx"
Setting "Break on first line" also doesn't stop the debugger, as well as changing the browser.
Please take a look at my config, what is wrong, what else to check?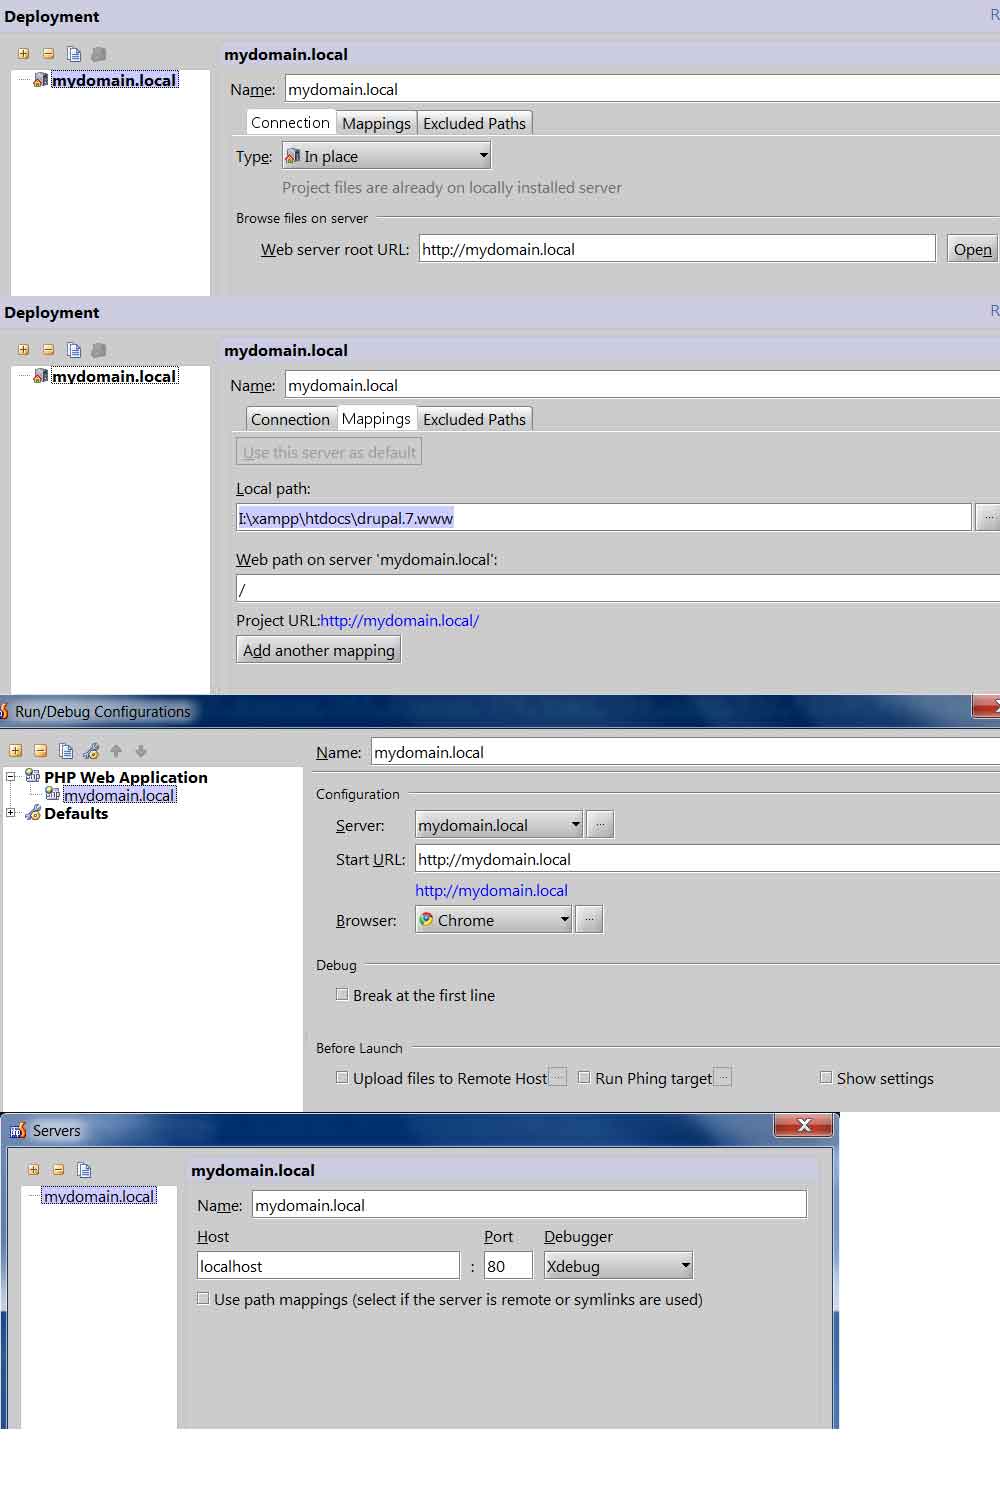
P.S. clicking on the image makess it more readible
Please sign in to leave a comment.
Hi there,
The type of Run/Debug Configuration makes big difference as "PHP Web Application" one requires you to control xdebugger (via bookmarklet or some browser extension) while "PHP Remote Debug" will initiate debugger for you.
It can also be a path mappings thing if symlinks (or alike) are used.
Isn't it the opposite? Because when I use "PHP Remote debug" mode instead of "PHP Web application" then after pressing "Debug" nothing happens (the page is not opened automatically) except that a message "Waiting for connection with ide key '1' appears.

Not sure if this is the way to go in case of Remote debugging, but after typing into the browser url "http://mydomain.local/?XDEBUG_SESSION_START=1" (such string was in the url when I used the other debug mode, only key was different) the page just loads and "Waiting..." is still there. No stop on breakpoints.
Anyways, I would like to just press Debug and the debugger should start the page which is specified in configuration.
I don't have symbolic links (this is Windows) or any other hard shortcuts.
Update:
According to the bookmarklet link you posted, I also tried the following string with Remote debug: http://mydomain.local/?XDEBUG_SESSION=PHPSTORM;path=/ but it doesn't stop the debugger either. I don't know where to put the session key=1 into this string
By the way, the Bookmarklet link works this way: after pressing Generate and copying the xdebug Start Session link, this is copied to clipboard:
javascript:(/**%20@version%200.5.1%20*/function()%20{document.cookie='XDEBUG_SESSION='+'PHPSTORM'+';path=/;';})()
I think one needs to change it a little as I did above.
Message was edited by: beamar
I fixed it. Sorry, it was not a Php Storm issue, it was an issue with my XDebug configuration. I reinstalled Xampp but did not reinstall XDebug (because new Xampp did not touch my php.ini, old and new were identical, Apache and MySql had the identical configuration, so I thought Xdebug also does not need reinstall). Well, after reinstalling Xdebug all is ok again.
You are correct -- my mistake.
Try this for PHP Web Application configuration:
In general -- maybe you have changed php/xdebug config? Please check:
If I create PHP Web Application configuration and provide this kind of URL ( http://idetest.dev/test.php ) then this is the actual URL that will be launched: http://idetest.dev/test.php?XDEBUG_SESSION_START=12026
You do not need to change anything -- no need for copying it:
You have to put that session key (which is "1") into appropriate field on bookmarklet generator before hitting "Generate" button.
Windows Vista and above already supporting symbolic links. In previous versions (Win 2000 and newer) Junction points were available (for folders only). Why I think you may had some links/mapped drive etc -- the drive letter I:/ -- quite high (quite possible it's some sort of substitution/joint point .. or you seems to have a lot of partitions/hdds etc).
In any case -- if none of the above helps, please collect debugger logs (ideally both) -- it may tell you straight away what is going on (if xdebug is trying to connect or not; if yes -- why no connection succeeds (path mapping issue?)):
Ahh .. good to know -- while I was typing my reply and waiting until it finish posting (takes like 5 mins or so to post) you already fixed it ... Now all my ideas ca be thrown in a bin :)
Thanks fo the tips - I'll have to use Remote debugging soon anyway , so it'll be useful to know the configuration tricks.
Andriy,
Thanks!:)
I am having similar problems but can't match the solutions here to my problem. When I try to create a run/debug configuration for my web project in IntelliJ2023 Ultimate, I select PHP Web Page from the Add New Configuration list. The panel that opens wants a Server name (XAMPP) and a Start URL, which I give as http://localhost:63342/MyProjectName/index.php. Below that it tells me to install Xdebug which I did after installing XAMPP and used the updated php.ini. It then tells me to Validate Debugger Configuration on Web Server. Clicking that link opens a dialog box that gives me four options. I am guessing that Local Web Server or Shared Folder is what I want? When that is selected, the dialog looks for (1) Path to create Validation Script and (2) URL to validation script. I have no idea what do? How do I set those two things?
Dougrimmer, 63342 isn't your XAMPP port, it's the IDEA built-in web server port.
Please note that you don't actually need a run/debug configuration for PHP web debugging - doing that all from the browser is the correct approach here. Please check the following help article:
https://www.jetbrains.com/help/phpstorm/zero-configuration-debugging.html
Also, please clarify if you open the project directly from the web root (where XAMPP loads sources from), or it's a copy residing somewhere else?
Thanks for the reply.
My project is located at users\myusername\Ideaprojects\myproject.
If I understand your question properly, I open my project using Index.php which is located in the top-level of the above project location. Is that what you meant?
I will check out the zero-configuration option.
Thanks.
Yes, thank you. So, your project isn't actually served by XAMPP because the sources are not located in the XAMPP web root.
To fix that, please create a deployment configuration of the local type that would place your project under the web root, make the configuration default, and optionally, enable automatic uploading at Setttings | Build, Execution, Deployment | Deployment | Options.
After that, invoke Tools | Deployment | Upload to... on the project root. After that, your project can be served by XAMPP, and you should be able to open the index.php page in the browser via
https://localhost/project-path-relative-to-web-root/index.phpThen, if you still want to run Web Server Debug Validation, you will need to use the
Local Web Server or Shared Foldertab, wherePath to create validation scriptwould be the project root inIdeaProjects, andURL to validation scriptwould behttps://localhost/project-path-relative-to-web-root/.Hello Eugene
Thanks very much for this extended help. Much appreciated. I have gone back and worked through the zero-configuration-debugging document and I now have that working.
I continue to work on creating deployment configuration in order to try and understand how that works. I am not all the way there yet but making progress. You have certainly pointed me in the right direction.
I appreciate the good support provided by JetBrains!