devcontainer only: missing Console in Debug window

Hello!
i am working since a couple of days with devcontainers and i am missing something important: my debug console!
Debugging works fine, IDE stops on breakpoints and anything else. But i don't have the console window!
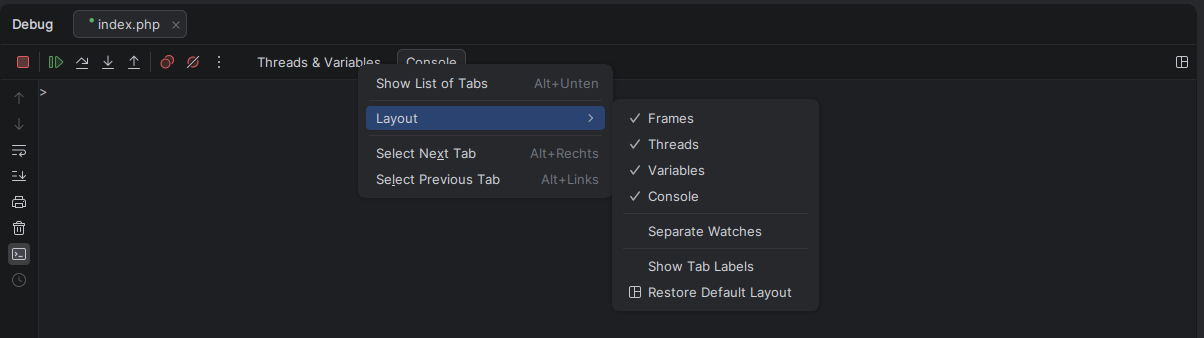
Running xdebug session in local phpstorm:
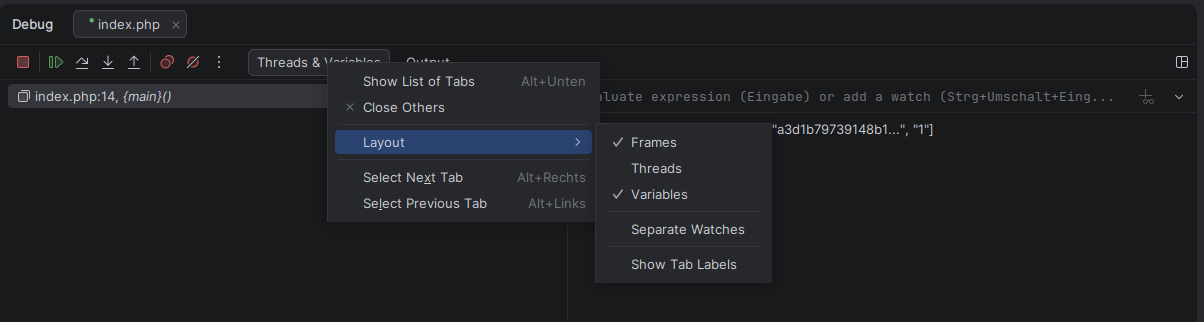
Running xdebug session in devcontainer:
Any idea?
Whats wrong here??
Please sign in to leave a comment.
Hello!
I was not able to quickly reproduce it both locally or in DevContainer/Split Modes:
Just to confirm that we are on the same page, what IDE version are you currently using?
yes, this window i don't have: Console
PhpStorm 2026.1.2 on Manjaro Linux (Gnome), using Docker CE 29.5.0 with PHP Image “8.4.14-fpm-trixie”
Thanks!
It is exactly the same version as mine, but I still cannot reproduce it in different scenarios, though.
I wonder if logs can tell more on what is going on or what is so different in your setup; do you think you could collect and share them?
Logs can be collected via “Help > Collect Host and Client Logs”.
Afterwards, you may either upload these to the JetBrains Upload services (let me know the upload id) or submit a support/YouTrack ticket.
https://uploads.jetbrains.com/
Vasiliy Yur how do you start debugging?
When i just click on the green bug button in the top menu bar “Debug foobar.php" then i have a console window like yours:
But usually i start it by my Web Browser (using Firefox extension “Xdebug helper” and click on the other green bug button “Start Listening for PHP Debug Connections” in my IDE before).
Vasiliy Yur Upload id: 2026_05_26_UtzcRLkgs5Z2pwSBqQyFRX (file: RemoteDev-logs-20260526-113550.zip)
What i did: Open local IDE, run devcontainer, start listening for debug sessions, open file via web browser (debug console opening, but without console), finally close debug session
Notice: i even don't have a console if i run the same “debug command” manually (printed on my last screenshot)
The only difference is that I also need to trigger Xdebug manually (because i don't know how PhpStorm trigger the xdebug session):
XDEBUG_TRIGGER=1 /usr/local/bin/php -dxdebug.mode=debug -dxdebug.client_port=9003 -dxdebug.client_host=127.0.0.1 /workspace/aua/web/index.php
Hey,
Thank you for all these updates and logs.
I have finally managed to reproduce the issue by enabling the xdebugger.toolwindow.split Registry option both on host and client:
As it turns out, it is a known issue:
https://youtrack.jetbrains.com/issue/WI-83021/Tabs-Console-and-Output-are-not-displayed-in-debugger-tool-window-in-split-mode
I cannot see it from logs, but is there any chance that you have this Registry option enabled?
To access the Registry, invoke Search Everywhere (shift-shift) and look for “Registry” and “Registry (On Host)” options.
Vasiliy Yur i have uncheckt xdebugger.toolwindow.split, restarted my IDE and recreated my devcontainer, but still no console within devcontainer.
To confirm, have you unchecked it in both Registries?
Vasiliy Yur yes, i have double checked it. And i even unchecked xdebugger.toolwindow.split.remdev
Hm.. I have just tried the whole cycle (enable→reproduce→disable→not reproducible), and things work fine for me.
Is it possible that a standalone version of IDE was still running when you re-opened the DevContainer IDE instance?