Code coverage for applications
https://www.jetbrains.com/help/idea/code-coverage.html
"Measuring code coverage is available for testing, applications, and application server run/debug configurations"
I wish to get coverage information from running and externally testing the application - NOT from unit tests.
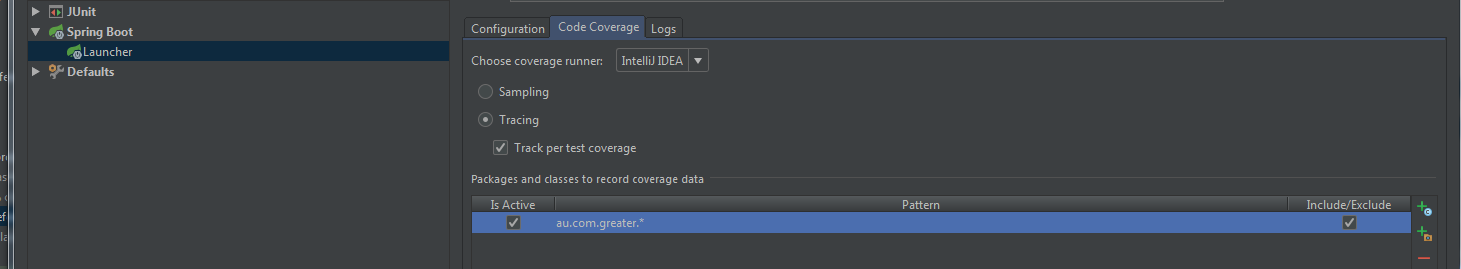
I have configured a Java Spring Boot configuration with code coverage
In the console when it's launched i see
---- IntelliJ IDEA coverage runner ----
tracing and tracking per test coverage ...
include patterns:
au\.com\.greater\..*
exclude patterns:
I then stop the application, and the coverage window is launched.
 I think i've tried every combination of sampling, tracing, and the three coverage runners.
I have tried with wildcards for packages, and distinct classes.
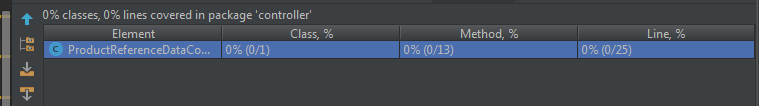
All runs say 0% coverage.
The only way i CAN get coverage is if i insert a system.exit(0) call, possibly as per
Is this a known issue ? Or am i doing something wrong ?
Please sign in to leave a comment.
What IDE version do you use? What JDK do you use? Are you sure the class is located under the au.com.greater package and it's methods are executed? E.g. I see the status line in Coverage tool window displays the package 'controller'. Also please check do you see the coverage data in Editor (in the left gutter). Are there any errors in log?
If issue remains, could you provide a sample project (for me it works fine)? Thanks.
The key point to me is that when i insert the system.exit(0) i DO get the coverage data, and the coverage data lines in the gutter i.e I change ONLY this and i go from not getting the data to getting the data.
IntelliJ IDEA 2018.1.5 (Ultimate Edition)
Build #IU-181.5281.24, built on June 12, 2018
Licensed to *****
JRE: 1.8.0_152-release-1136-b39 amd64
JVM: OpenJDK 64-Bit Server VM by JetBrains s.r.o
Windows 7 6.1
Answers to your questions
- Yes the class is located under au.com.greater
- Yes the method is executed. I run the same external calls with the program running under the debugger and i hit breakpoints in this location
- I don't see any coverage data in the gutter.
- Checking the log file i see an error, but only related to when i try the jacoco coverage runner
I'll investigate this error more.
To be clear - could you please confirm that you get this coverage data NOT when running tests, but when simply when running the application with coverage ? I suspect this to be the case, but want to be sure.
The first time I tried to reproduce - the Spring Boot Application exited by itself, so there was code coverage. When I launch and use 'Stop' button - I also see not coverage. Created the https://youtrack.jetbrains.com/issue/IDEA-195386 to investigate. Please follow it for updates. Thanks.
Thanks Andrey, much appreciated.
I didn't see your comment around a test project. I'm assuming since you've been able to reproduce it that's no longer necessary ?
And I should have been clearer. My application is a service, so it doesn't terminate, i stop it using the 'stop' button in the IDE i.e the same as you outlined above when you reproduced the issue.
This may turn out to be a limitation of whatever is collecting the coverage data - i've seen mention in the jacoco documentation of an agent (i'm not a java guru so i'm not familiar with the internals of how it might collect coverage data) - so if it turns out that it's difficult to resolve then calling out the workaround of exiting the process in the documentation would be sufficient.
Yes I've reproduced it on Windows. On OS X it worked for me (coverage showed after pressing 'Stop').
Thanks for details. You may follow the https://youtrack.jetbrains.com/issue/IDEA-195386 for further progress.