Problem using Remote Debugging

I am using PhpStorm 2017.1.4 on Amd64 with Debian64 and Php7.0. Unfortunately, there is a Problem using the Remote Debugging with Php's integrated Web Server. I followed all Setup-Instructions stated on the Jetbrains Website.
On a former PhpStorm install, those steps worked. Now, Breakpoints dont work. I tried the Web Server Debug Validation resulting in "Connection refused".
The PhpStorm PhpInfo states:
xdebug.remote_addr_header
xdebug.remote_autostart=0
xdebug.remote_connect_back=0
xdebug.remote_cookie_expire_time=3600
xdebug.remote_enable=0
xdebug.remote_handler=dpgp
xdebug.remote_host=localhost
xdebug.remote_log="/tmp/xdebug.log"
xdebug.remote_mode=req
xdebug.remote_port=9000
And this is my additional 20-xdebug.ini, which is recognized by both PhpStorm and Php:
[Xdebug]
zend_extension=xdebug.so
xdebug.remote_enable=On
xdebug.remote_host=localhost
xdebug.remote_port=9000
xdebug.profiler_enable=0
xdebug.remote_log="/tmp/xdebug.log"
When using the command "php -i" in Terminal, the xdebug.remote_enable has the local and Master Value "On".
I'm not sure what is causing this, since the Jetbrains Chrome Extension tells me that is it connected to PhpStorm, but no incoming Connection Window appears.
If more Informations are needed please tell me.
Thank you.
Regards
请先登录再写评论。
Hi there,
>I'm not sure what is causing this, since the Jetbrains Chrome Extension tells me that is it connected to PhpStorm, but no incoming Connection Window appears.
Please provide screenshots with your debugging window etc.
You do not need JetBrains Chrome Extension to debug PHP code. If you see that message .. then you most likely are doing JavaScript debug instead of PHP.
Just in case: https://confluence.jetbrains.com/display/PhpStorm/Debugging+with+PhpStorm
Hi,
thank you for your Advice. Which debugging window do you mean?
Regards
The one that you should see when you click on "Debug" button in IDE.
When using Run->Debug it starts normal. Thats good but I need to Debug in Remote, but it wont stop at breakpoint.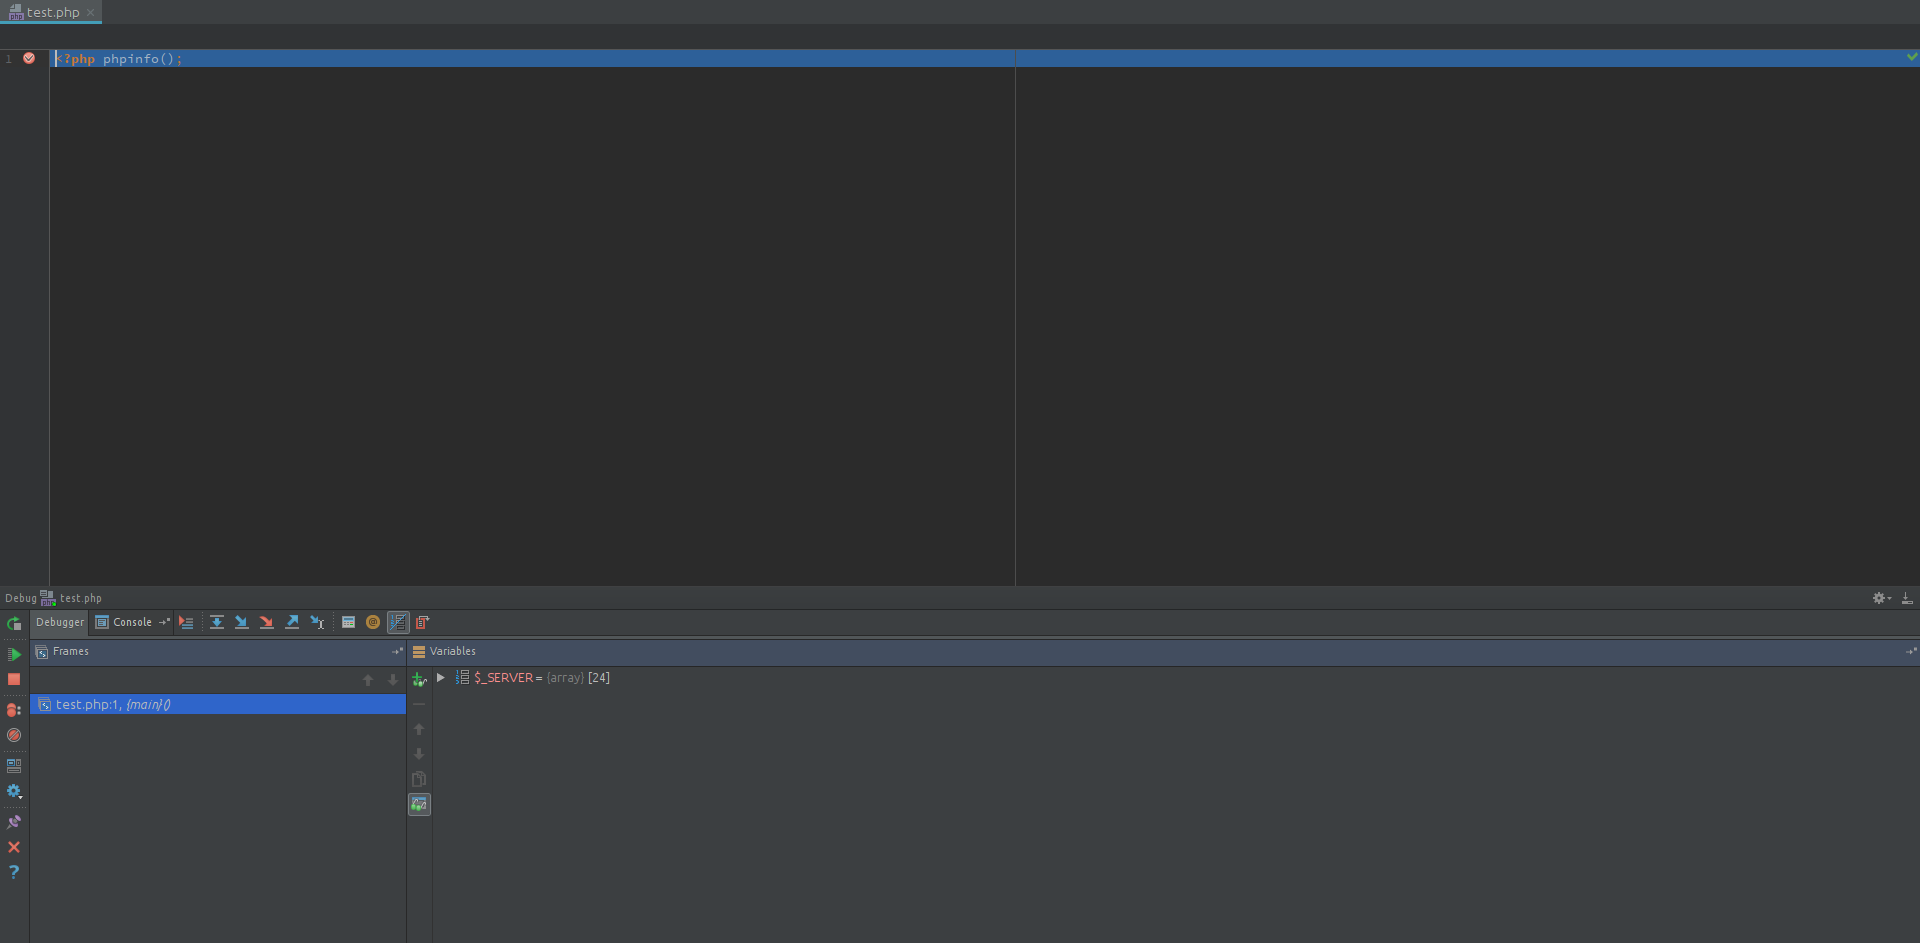
Do you mean this Window?
Regards
>Do you mean this Window?
Yes, that one. It's a PHP debug.
>Thats good but I need to Debug in Remote, but it wont stop at breakpoint.
You need to provide details .. because I have no clue about what exactly you mean under "remote" there. Is that when you have have PHP code running on another server/VM .. or just anything that is executed via browser (as opposed to the "PHP Script" that you do right now)? Details please.
P.S. xdebug.remote_enable must be On/1 in order for xdebug to work.
Hello,
it is like you have the php code on another server, but it also should run under local server. I already set xdebug.remote_enable to On but it makes no difference. PhpStorm still tells me it is set to Off. The Debug Session wont start. Please tell me which logs and screenshots I shall supply.
Regards
>it is like you have the php code on another server, but it also should run under local server.
This does not make it any clearer.
I say:
Show whole xdebug section of the phpinfo() output captured via browser (you will be debugging your web pages, right?)
>I tried the Web Server Debug Validation resulting in "Connection refused".
Some more details on this -- what did you use for the server etc.
In general -- IDE uses that deployment server to upload that test script into the website's root folder and then executes it (that's how it gathers all that info). It's possible that you either provided invalid deployment config .. or your config does not allow that URL/script to be executed. Check your server/FTP logs to see what file it was trying to upload/execute.
>PhpStorm still tells me it is set to Off.
Says where? Some screenshots are welcome.
Keep in mind: On Linux/Mac it's common these days to have 2 sets of php.ini -- one for CLI and one used by Apache. It's possible that the one you see in PhpStorm is for CLI.
P.S. I have seen a case where PhpStorm and PHP itself were reporting "xdebug.remote_enable = off" but it was still able to debug (it was on Mac where code was run inside some Vagrant machine).
Providing xdebug log may also help: https://xdebug.org/docs/all_settings#remote_log
> I have seen a case where PhpStorm and PHP itself were reporting "xdebug.remote_enable = off" but it was still able to debug (it was on Mac where code was run inside some Vagrant machine).
We also need to remember that web server may use different php.ini with different parameters. "Remote_enable" could have been enabled in ini file that web browser used.
>We also need to remember that web server may use different php.ini with different parameters. "Remote_enable" could have been enabled in ini file that web browser used.
1) I've mentioned that in previous paragraph
2) In my case (was helping someone on this forum via TeamViewer session) I was double checking the ```phpinfo()``` output via browser as well .. as well as was grep'ing all *.ini files looking for a file in another location (in addition to checking the list of loaded .ini files reported by PHP) -- PHP was reporting "off" but debugger somehow worked (not in 100% session though but in majority of them (lets say 9 out of 10)). The person was happy with such results and I have not heard anything after that (possibly he re-did that VM or something like that).