Debugging IntelliJ which is debugging Javascript
I have a language which transpiles to Javascript. To debug it, I do as follows:
1. Fire IntelliJ A (the latest Ultimate EAP, (IU-162.2228.15 EAP 2016.2.5)
2. Select plugin debug configuration and click Debug
3. That fires IntelliJ B (Same EAP)
4. In B, I select JS debug configuration and click Debug.
By the time I do 4, the built-in HTTP server port (63342 if I am not mistaken?) is already taken by A.
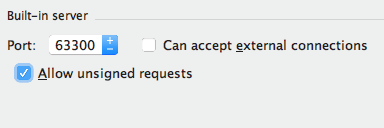
So, I explicitly changed the port: in A,
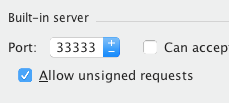
And in B,
I am getting this:

I tried to change the port in chrome-extension://for JetBrains IDE Support to various different values, including 63343, 33333, etc. Does not seem to help. What am I doing wrong?
请先登录再写评论。
Does debugging JS configuration from IDEA A works if you set ports in built-in server, Chrome extension and run configuration settings to the same value?