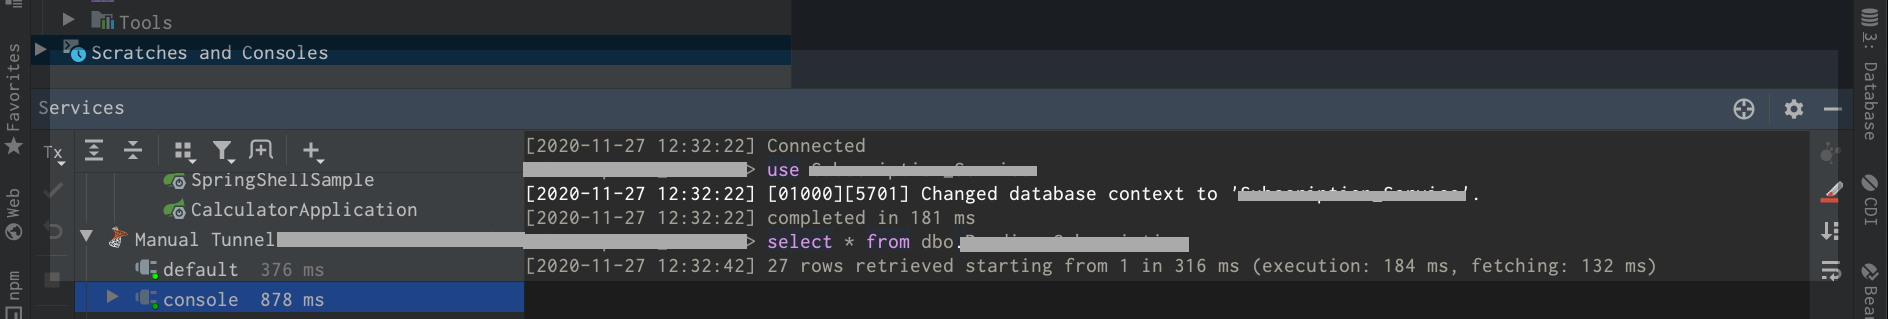
I was able to view the queries generated when using a connected Data Source in the Database tool window ⌘3 (Mac) or View > Tool Windows > Database. After connecting, selecting a table and then ⌘↓ to "Jump to Editor", the query that is executed can view viewed from the Services tool window ⌘8 or View > Tool Windows > Services. Click on the connected data source from the list of services in the Services window, and the logs should be viewable just to the right of the screen.

Several ways to observe query history.
1. Full SQL log file: Literally all queries from the IDE are now logged in a text file.
To open this file, go to Help | Show SQL log.
2. Use console query history: press this icon on the output panel or console toolbar
3. Observe Local History, it can be found in the context menu
Hi,
I created an issue based on you description https://youtrack.jetbrains.com/issue/DBE-3564
Thank you.
Hi,
I am on DataGrip 2020.3 I do not have option #2.
And where do I find local history?
I think the whole SQL statements history retrieval experience should be streamlined.
I was able to view the queries generated when using a connected Data Source in the Database tool window ⌘3 (Mac) or View > Tool Windows > Database. After connecting, selecting a table and then ⌘↓ to "Jump to Editor", the query that is executed can view viewed from the Services tool window ⌘8 or View > Tool Windows > Services. Click on the connected data source from the list of services in the Services window, and the logs should be viewable just to the right of the screen.