Debugging JSPs in WebLogic 10
I'm trying to get debugging JSPs in WebLogic 10 working. Is there a similar paper for WebLogic as How to configure remote JSP debugging under WebSphere Application Servers.
I've created an "Application Server", WebLogic 10 where I've pointed to classes: c:\bea\wlserver_10.0\server\lib
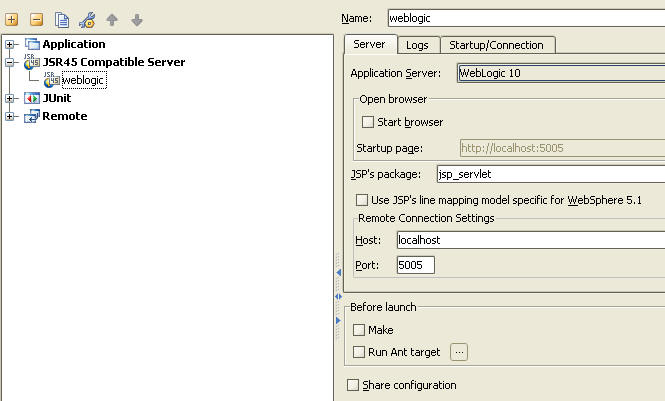
I then created a Run/Debug configuration for a remote JSR45 Compatible Server. Here I specified my app server as WebLogic 10. I'm not using the "Start browser" functionality.
I specified the JSP's package as "jsp_servlet". Generated .class/.java files are stored here:
C:\bea\user_projects\domains\abc\generated_jsp\jsp_servlet
Debug connection points to port 5005. Connection is successfully made when starting debug session. However, JSP breakpoints aren't reached in IDEA.
My JSPs are accessed via Plumtree portlets, so they are not opened directly, e.g. http://localhost:8080/my.jsp.
Is there some other place to get information or can someone point out what I might be missing?
Thanks,
Jim
Edited by: Jim Clark on Jun 11, 2008 6:17 PM
Attachment(s):
jsr45_settings.jpg
请先登录再写评论。
Hello Jim,
I have not investigated the problem yet. Just see that you use JSR45 configuration.
IDEA has built-in support for WebLogic (the plugin should be enabled). Maybe,
using WebLogic configuration instead of JSR45 will avoid your problem?
Alexander.