Possible to view call stack when debugging?

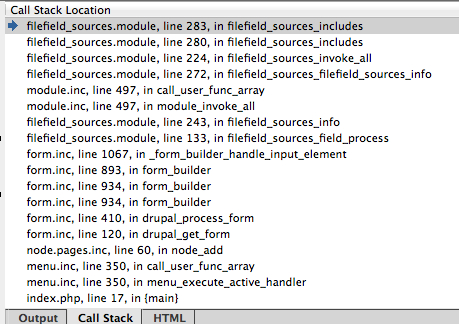
I am evaluating PHPStorm for use as my primary PHP IDE after using Komodo for a few years, and I have debugging with xdebug set up and working (not quite as easy to set up and use as Komodo, but not too bad). One debugging feature that Komodo has that I really like and use frequently is the call stack window (see attached image). At any breakpoint, not only can I view variables, but I can see the call stack from the beginning of the page load, and even click on the item in the stack to go right to that code. Does PHPStorm have anything similar? I've looked through menus and help as well as done some googling, but I can't find any way to view the call stack other that inserting lines in code (which isn't quite as powerful).
Thanks.
Attachment(s):
call_stack_window.jpg
请先登录再写评论。
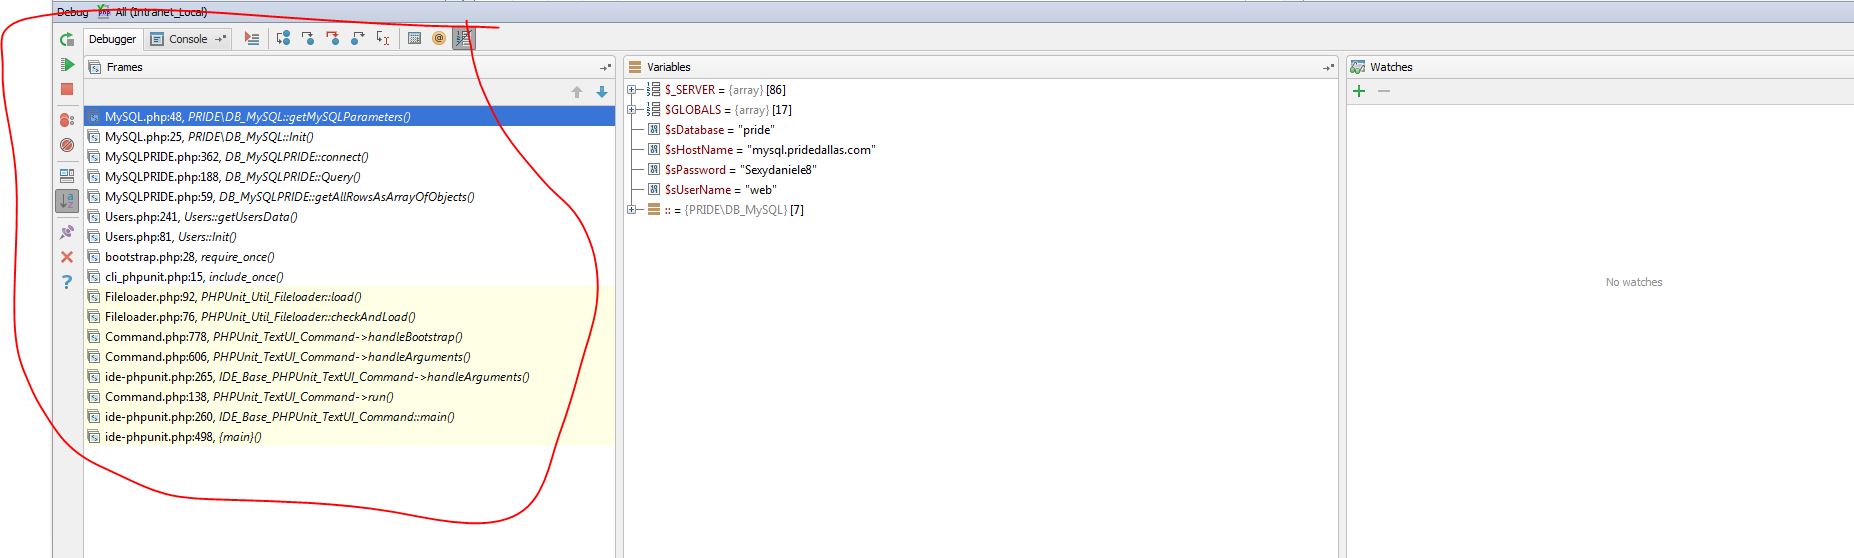
You mean like this?
Sigh. Major facepalm. Not sure how the heck I missed that one. Must have been the different font than what I'm used to. Yeah, that's it...
Glad I could help.
:)Actually, that's not a call stack. Frames are almost always useless when I try to debug anything (see this issue). Here's a screenshot: