Help With XDebug and PHPStorm
Hello,
Sorry my first post is one of need.
I downloaded PHPStorm today for the first time. It's only the 30 day trial version.
I'm using Windows 7 64.
I was having issues getting any sort of debug connection working locally, I have both PHPStorm and Apache on the same machine so all localhost here. So I uninstalled apache + php + mysql and started off with a fresh xampp install.
I simply created a new project and added a simple index.php file in it which is a couple directories down my web root.
webroot/a/b/index.php
I can run the file perfectly fine, just no debug connections for the life of me.
I opened php.ini and modified the specified XDebug options. Here is my phpinfo output for it.
xdebug
xdebug support => enabled
Version => 2.1.1
Supported protocols => Revision
DBGp - Common DeBuGger Protocol => $Revision: 1.145 $
Directive => Local Value => Master Value
xdebug.auto_trace => Off => Off
xdebug.collect_assignments => Off => Off
xdebug.collect_includes => On => On
xdebug.collect_params => 0 => 0
xdebug.collect_return => Off => Off
xdebug.collect_vars => Off => Off
xdebug.default_enable => On => On
xdebug.dump.COOKIE => no value => no value
xdebug.dump.ENV => no value => no value
xdebug.dump.FILES => no value => no value
xdebug.dump.GET => no value => no value
xdebug.dump.POST => no value => no value
xdebug.dump.REQUEST => no value => no value
xdebug.dump.SERVER => no value => no value
xdebug.dump.SESSION => no value => no value
xdebug.dump_globals => On => On
xdebug.dump_once => On => On
xdebug.dump_undefined => Off => Off
xdebug.extended_info => On => On
xdebug.file_link_format => no value => no value
xdebug.idekey => drox => no value
xdebug.manual_url => http://www.php.net => http://www.php.net
xdebug.max_nesting_level => 100 => 100
xdebug.overload_var_dump => On => On
xdebug.profiler_aggregate => Off => Off
xdebug.profiler_append => Off => Off
xdebug.profiler_enable => Off => Off
xdebug.profiler_enable_trigger => Off => Off
xdebug.profiler_output_dir => C:\Drox\xampp\tmp => C:\Drox\xampp\tmp
xdebug.profiler_output_name => xdebug_profile.%R::%u => xdebug_profile.%R::%u
xdebug.remote_autostart => On => On
xdebug.remote_connect_back => Off => Off
xdebug.remote_cookie_expire_time => 3600 => 3600
xdebug.remote_enable => On => On
xdebug.remote_handler => dbgp => dbgp
xdebug.remote_host => localhost => localhost
xdebug.remote_log => C:\Drox\xampp\tmp => C:\Drox\xampp\tmp
xdebug.remote_mode => req => req
xdebug.remote_port => 9002 => 9002
xdebug.scream => Off => Off
xdebug.show_exception_trace => Off => Off
xdebug.show_local_vars => Off => Off
xdebug.show_mem_delta => Off => Off
xdebug.trace_format => 0 => 0
xdebug.trace_options => 0 => 0
xdebug.trace_output_dir => C:\Drox\xampp\tmp => C:\Drox\xampp\tmp
xdebug.trace_output_name => trace.%c => trace.%c
xdebug.var_display_max_children => 128 => 128
xdebug.var_display_max_data => 512 => 512
xdebug.var_display_max_depth => 3 => 3
Here is my server settings...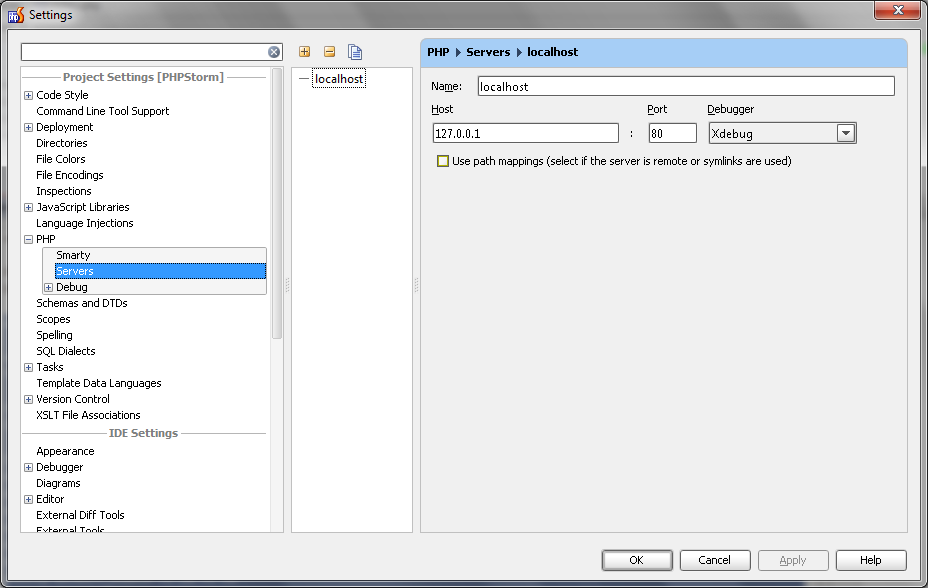
Here is my debug config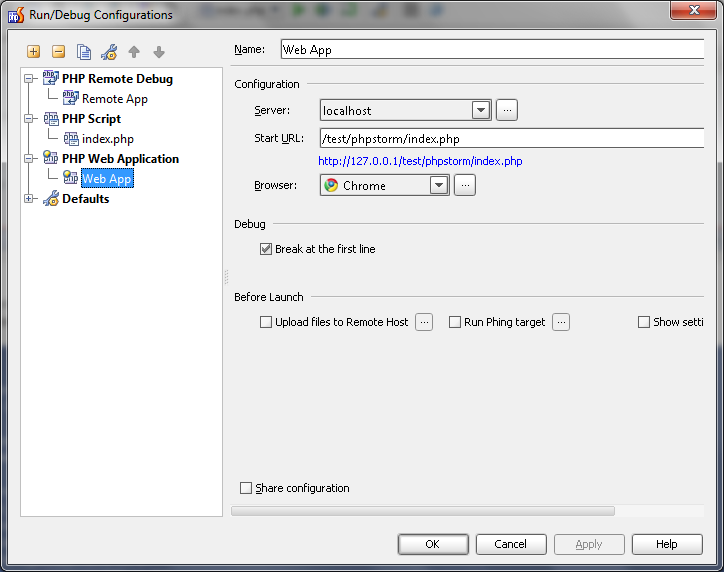
Does anyone have any suggestions?
I disabled my firewall completly to see if that was it, but no luck.
Thank you for your time
请先登录再写评论。
Hello Drox,
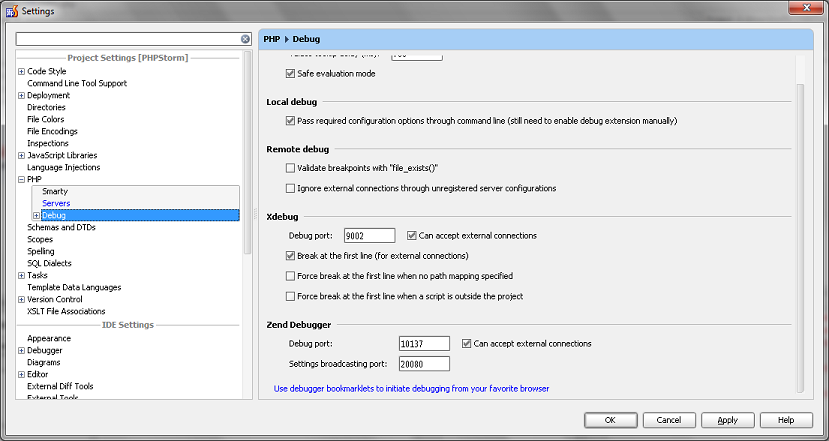
Have you set the same port number for Xdebug in the IDE settings (Project Settings | PHP | Debug)?
Thank you for feedback!
Yep, I did it because some windows service is currently hogging 9000.
One thing that's weird I noticed, my local and master idekeys are different no matter what I do.
local = drox
master = phpstorm
I changed the idekey in my debug config for remote... but no avil it never changes.
I also just tried installing the chrome extension to enable XDebug sessions for URI's.
Here is my php -> debug
Drox,
Could you please provide your xdebug log (http://xdebug.org/docs/remote#remote_log)?
Thank you for feedback!
Hi Nikolay,
Sorry for the late response. I actually had to reinstall windows 7 and that solved the issue whatever it was. PHPStorm is now fully operational!
Thanks