Why are inspections not showing in editor?
I can't figure out why my inspections have stopped running in my editor. If I run them manually, they'll still detect properly, I haven't disabled them in the inspections menu, but for some reason the editor won't perform them. Every editor tab shows a green check indicating no problems despite my manual inspections indicating there are actually a bunch of problems.
The inspections used to auto-run just fine, I'm not sure if I disabled a setting at some point on accident or what.
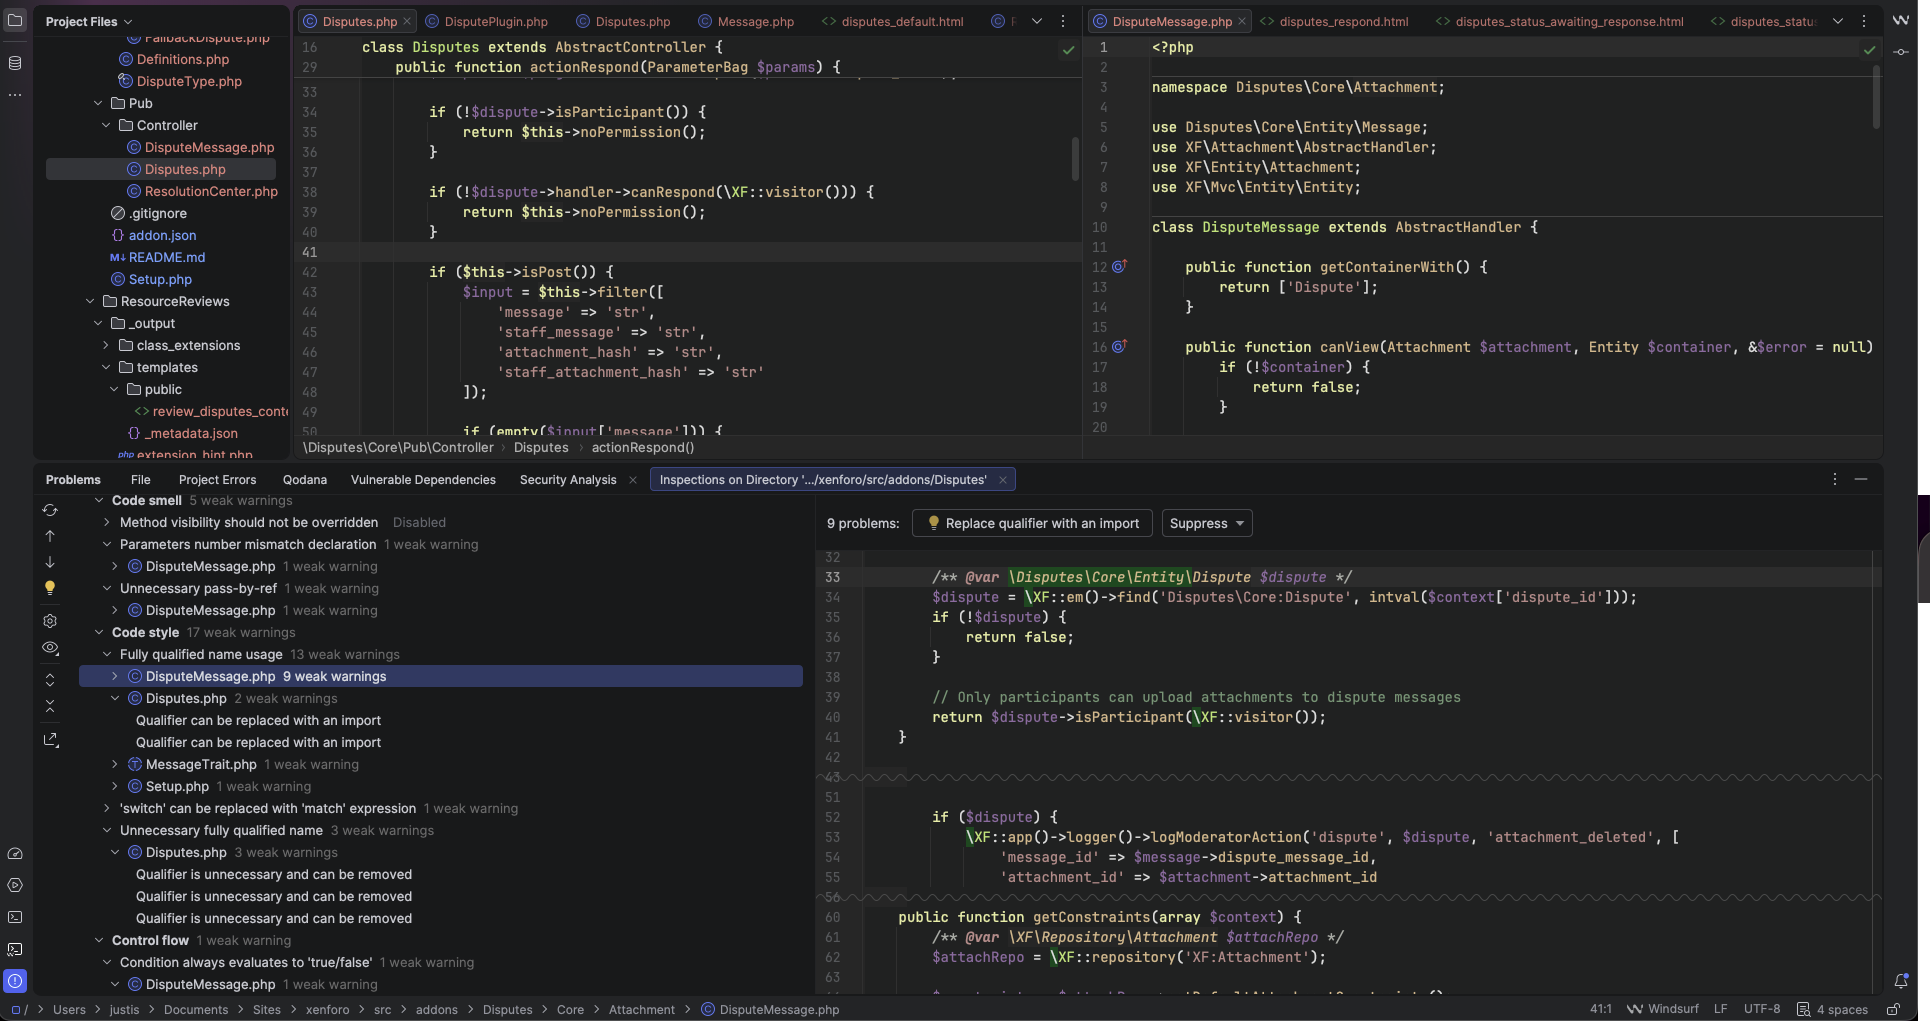
Lower half shows manual inspections. Upper half shows editors indicating no problems despite the clear inspection flags. Visiting the problems tab shows nothing wrong.
Checking log file shows no errors.
IntelliJ IDEA 2025.3.4
Build #IU-253.32098.37, built on March 17, 2026
Source revision: a1f2bc0e0d733
Licensed to Justis Root
Subscription is active until July 14, 2026.
Runtime version: 21.0.10+7-b1163.110 aarch64 (JCEF 137.0.17)
VM: OpenJDK 64-Bit Server VM by JetBrains s.r.o.
Toolkit: sun.lwawt.macosx.LWCToolkit
macOS 26.2
GC: G1 Young Generation, G1 Concurrent GC, G1 Old Generation
Memory: 2048M
Cores: 14
Metal Rendering is ON
Registry:
debugger.new.tool.window.layout=true
ide.experimental.ui=true
maven.packagesearch.enabled=false
Non-Bundled Plugins:
com.intellij.notebooks.core (253.32098.37)
JavaScript (253.32098.37)
com.intellij.java (253.32098.37)
org.jetbrains.completion.full.line (253.32098.37)
Subversion (253.32098.60)
com.intellij.kubernetes (253.32098.40)
com.intellij.spring.boot (253.32098.37)
com.codeium.intellij (2.12.20)
com.jetbrains.restClient (253.32098.37)
com.intellij.javaee.jpa (253.32098.37)
intellij.jupyter (253.32098.37)
Docker (253.32098.40)
tanvd.grazi (253.32098.37)
com.intellij.settingsSync (253.32098.37)
org.jetbrains.idea.maven (253.32098.37)
PerforceDirectPlugin (253.32098.39)
com.intellij.spring.mvc (253.32098.37)
com.jetbrains.php (253.32098.37)
Kotlin: 253.32098.37-IJ
请先登录再写评论。
I've tried updating everything, restarting, checked the log file for errors (there were none), I've tried creating a new custom scope that specifically includes the files and adding that scope to every inspection, nothing seems to get them to show up in the editor with highlighting as they used to.
Hello Justis Root
I wasn't able to reproduce the problem because the root causes could be different. Could you please check the following:
Code analysis is enabled:
Power save mode is disabled:
Verify the inspection profile is the same
Confirm if this happens in all projects or only in a specific one, and in all files or only in particular file types. If it’s only in some files, double-check that they’re not marked as Plain Text or located outside the project’s source roots.
If nothing above helps, please do the following so we can investigate further:
Once I have those details, I should be able to find the root cause of the problem.
Upload id: 2026_04_09_stcfXGoHnvkF2HgwLjVpqU (file: idea-logs-20260409-01471915003344201147973173.zip)
Editor not inspecting file:
Inspections working only when running them manually:
After proceeding with work, I've noticed that inspections are still running properly in SOME files within the project while not running properly in others despite being in the SAME project.
So to clarify, only specific files within the project are impacted, other files within the project are inspecting properly. Power save mode is not active. The correct profile is selected in the inspections editor. The files are also properly identifying as php files, as you can see in the dropdown “PHP: All problems”.
Hello Justis Root
I reviewed the logs but didn't find any errors related to this. So I think you may have accidentally changed the Highlighting effect. Please check the following:
3. Go to Error and Warnings, unfold it, and select Weak Warning
4. Verify if the Effect checkbox is checked. If it's not, then please check it so the color will be shown under the weak warning:
Please let me know the result of this.
Unfortunately, the highlighting effects are all as they should be. My inspections configuration is mostly default anyways. Just again, the inspections are only missing for some files, on the rest of my files within the project they work as intended.
I reviewed the logs again to find a clue, and it looks like the files where live inspection is not shown may be excluded from the source roots. To fix this, please try the next:
Check the affected files’ status in the IDE and make sure they are:
If needed, re-add the folder to the content root and remove any exclusion marking.
If the previous steps did not help, please share your project structure and a list of affected files so I can analyze further. Please do it through our secure upload site https://uploads.jetbrains.com/, and share the uploadID.
Ah, I see the problem.
The content root within my project (~/Documents/Sites/xenforo) is a symbolic link, and it looks like when I originally marked it as a content root, IntelliJ decided to add the destination folder of the symbolic link to my project files instead of marking the symbolic link as the content root, so when I opened files through the symbolic link, it was not considered part of the source files despite being the same files as present within the symbolic link's target folder which IntelliJ had added to my project without my having noticed. The files that inspections were working on were files I'd opened through the finder window, which searched both folders as if they were unique folders.
I can't seem to get IntelliJ to recognize my symbolic link as the content root, it just keeps adding the target folder to the project instead.
Anyway, thank you so much for your help Monica at least I know what started this and where to go from here.
Hi Justis Root,
Thanks for the update. I confirm that what you found is the actual root cause.
On-the-fly inspections only work for files that the IDE considers part of the content root, and files outside those roots or marked as excluded are ignored by inspections. If your project was added using the symlink’s target directory, but some files were later opened via the symlink path, the IDE may treat them as separate paths, which would explain why inspections worked for some files but not others.
For the project structure itself, the safest approach is to use the real target directory as the content root and avoid mixing files opened through both the symlink path and the resolved path in the same project. If you need code from multiple real locations, it’s better to add them as separate content roots instead of relying on symlink aliases:
Ctrl+Alt+Shift+S).IntelliJ IDEA supports multiple content roots within a single module, specifically for code stored in different locations.
After adding the separate content roots, you can mark folders as needed from either the Sources tab or by right-clicking a folder in the Project tool window and using Mark Directory as.
For your case, the safest setup would be:
I’m glad you were able to track down what was happening, and I hope this helps to achieve what you need.