CLion gdb debugging printing format
已完成

Hi,
How can I print something in clion debugging similar to what gdb command line can do.
For example;
pid_t pid = getpid()
CLion show it like this:
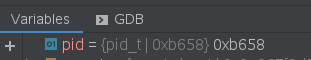
While in the command line you can do this:
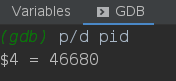
Is there an identical way for the debugger ?
Thanks ahead.
请先登录再写评论。
Hi,
I have the same issue. Most likely you have an incompatible gdb version. Try installing the clion-gdb package if you're on Linux, otherwise use gdb 8.3.x.
If you're on Windows, you might find what you need on this post: stackoverflow.
What do you mean by incompatible ? I also tried the build it gdb and got the same result.
Is there any configuration that cause this ?
Here is my ~/.gdbinit:
set confirm off
set verbose off
set history filename ~/.gdb_history
set history save
set history size 1000
set output-radix 0x10
set input-radix 0x10
# These make gdb never pause in its output
set height 0
set width 0
set prompt \033[31mgdb$ \033[0m
set follow-fork-mode child
set detach-on-fork off
set print elements 0
set print pretty
set disassembly-flavor intel
set auto-load local-gdbinit on
add-auto-load-safe-path ~/gdb_init
set auto-load safe-path /
----
EDIT: I just found the reason, the following lines were the issue:
set output-radix 0x10
set input-radix 0x10