intellij ultimate 2020.1.4 -- javascript debugger doesn't connect to session

starting debug opens the browser and "JetBrains IDE Support" started debugging this browser is displayed in the browser. However, IntellIJ does not connect and returns the debug window to the unconnected state with the bug icon enabled. Here's what I see in the log:
2020-07-22 12:41:18,594 [1061816] WARN - jetbrains.rpc.CommandProcessor - connection null
2020-07-22 12:41:18,599 [1061821] WARN - jetbrains.rpc.CommandProcessor - connection null
2020-07-22 12:41:18,768 [1061990] INFO - .javafx.JavaFXConsoleHtmlPanel - WebConsole page loaded
2020-07-22 12:41:18,770 [1061992] INFO - .console.WebConsoleHistoryView - WebConsole page initialization complete
2020-07-22 12:41:18,770 [1061992] INFO - .javafx.JavaFXConsoleHtmlPanel - initialization complete
2020-07-22 12:41:22,302 [1065524] WARN - jetbrains.rpc.CommandProcessor - connection null
2020-07-22 12:41:22,307 [1065529] WARN - jetbrains.rpc.CommandProcessor - connection null
2020-07-22 12:41:22,446 [1065668] INFO - .javafx.JavaFXConsoleHtmlPanel - WebConsole page loaded
2020-07-22 12:41:22,448 [1065670] INFO - .console.WebConsoleHistoryView - WebConsole page initialization complete
2020-07-22 12:41:22,448 [1065670] INFO - .javafx.JavaFXConsoleHtmlPanel - initialization complete
2020-07-22 12:41:34,393 [1077615] INFO - j.ide.actions.RevealFileAction - Exit code 1
Her's what the debug windows looks like:

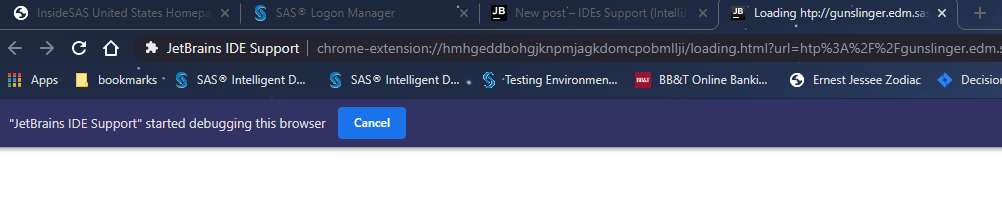
and finally, here's what chrome looks like:
请先登录再写评论。
Chrome extension is not currently required for debugging/Live Edit. It doesn't work reliably in most recent Chrome versions (https://youtrack.jetbrains.com/issue/WEB-37230)
Please try turning it off in Settings | Build, Execution, Deployment | Debugger | Live Edit, Use JetBrains IDE Support extension for debugging and Live Edit - does the issue persist?
That fixed it. thank you very much!