Debugging with LPC-Link 2 (RedLinkServer)
Hello there!
Recently I've managed to set up CLion to build and flash a NXP QN908x Make based project. Now, I'm trying to integrate it further in CLion and be able to use its debugger. The debugging probe I'm using is a LPC-Link 2. The command that MCUXpresso (Eclipse based IDE for NXP) is using to launch the debugger looks like this:
(gdb) target extended-remote | crt_emu_cm_redlink -msg-port=53271 -g -mi -4 -pQN908XC -vendor=NXP --connectscript=RunBootRomConnect.scp --resetscript=qn908xreset.scp --reset= -ProbeHandle=1 -CoreIndex=0 -cache=disable --flash-hashing --flash-driver= -x /path/to/QN908XC_support --flash-dir /path/to/binaries/Flash
I would like to ask what would be the best way to integrate this in to CLion debugger.
What I've tried so far
I've used a GDB remote debug configuration, as follows

In principle, this configuration launches GDB and runs the piped command with some errors.
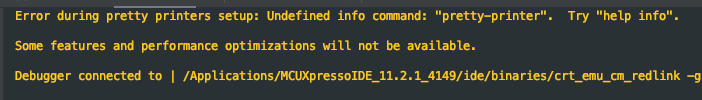 But it behaves weird. Some breakpoints are hit, others not. If I step through the code line by line, it behaves erratically, as it jumps from one function to another all the sudden without it being called. I'm using FreeRTOS, and I'm not sure if that would be the scheduler changing tasks. The thing is that if I run arm-none-eabi-gdb from the command line and run these commands (in addition I call (gdb) file path_to/firmware.axf & (gdb) load), it behaves fine.
Do you guys have some clue or some suggestion for the right configuration?
Also, I don't have a chance with this configuration to set some other parameters for gdb like "set arm force-mode thumb" or "set remotetimeout 10000". Where could I set those for this debugging session?
Thanks!
请先登录再写评论。