Debug Angular 2 app

Try to debug Angular application (2.4.1)
WebStorm 2017.1.2
Build #WS-171.4249.16, built on April 18, 2017
JRE: 1.8.0_112-release-736-b16 amd64
JVM: OpenJDK 64-Bit Server VM by JetBrains s.r.o
Windows 7 6.1
Application structure

Compile gulp task
function compile(prod, src, logfile) {
    var tsProject = typescript.createProject('tsconfig.json', {
        typescript: require('typescript')
    });
    return gulp
        .src('./src/app/**/*.ts')
        .pipe(sourcemaps.init())
        .pipe(tsProject())
        .pipe(sourcemaps.write('.', {
            includeContent: false,
            sourceRoot: '../../src/app/'
        }))
        .pipe(gulp.dest('./dev/app'));
}

gulp browserSync task
gulp.task('serve:dev', ['compileTs', 'watch'], function () {
    var proxy = require('http-proxy-middleware');
    var browserSync = require('browser-sync');
    var modRewrite  = require('connect-modrewrite');

    var apiProxy = proxy('/ui-api/**', {
        target: 'http://localhost:8081',
        changeOrigin: true,
        hostRewrite: true,
        logLevel: 'debug'
    });

    var apiProxyCsv = proxy('/csv/**', {
        target: 'http://localhost:8081',
        changeOrigin: true,
        hostRewrite: true,
        logLevel: 'debug'
    });

    var logoutProxy = proxy('/logout', {
        target: 'http://localhost:8081',
        changeOrigin: true,
        hostRewrite: true,
        logLevel: 'debug'
    });

    var server = {
        baseDir: ["./", "./src", "./dev"],
        index: "index" + options.htmlExt,
        middleware: [apiProxy, apiProxyCsv, logoutProxy, modRewrite([
            '!\\.\\w+$ /index.htm [L]'
        ])
        ]
    };

    var opts = {
        startPath: '/',
        server: server,
        browser: 'default',
        host: '0.0.0.0',
        open: 'true'
    };
    browserSync.instance = browserSync.init(opts);
});

For example full path to ts file: src/app/dir1/dir2/my.component.ts
Map files after compile: dev/app/dir1/dir2/my.component.js.map
and contain something like this:
{
'version':3,
'sources': ['dir1/dir2/my.component.ts'],
'names': [],
'mappings': ...,
'file': 'my.component.js',
'sourceRoot': '../../../../src/app/'
}
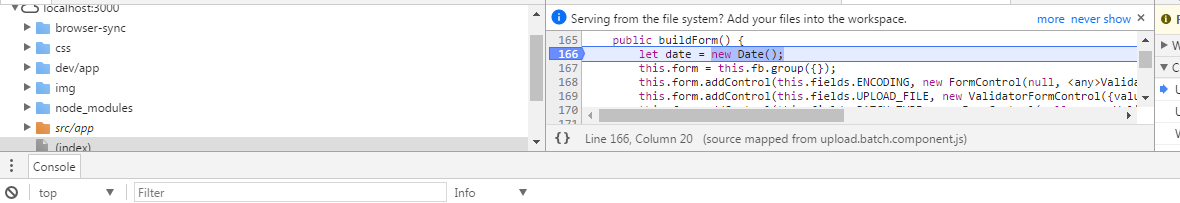
Breakpoints in my.component.ts doesn't work. Any ideas?
In Chrome (58.0.3029.81 (64-bit)) all breakpoints in ts files work
Sorry for text colors :)
Please sign in to leave a comment.
Usually such issues are caused by invalid sourcemaps produced by Gulp, but yours look OK at first glance.
Please open your my.component.js.map file in editor, open Visualizer tab, open the dropdown on the right side - does WebStorm suggest the right .ts file there? Can you provide a project I can use to recreate the issue?
yes, it's right ts file. The worst thing when I created test application with the same config but without real code - debug works. It means: sourcemaps is ok. But debug doesn't work in real application for another reason. I can't provide project because of NDA and it completely depends on server part and you can't start it. I'm confused and don't know what to do.
>The worst thing when I created test application with the same config but without real code - debug works. It means: sourcemaps is ok
debugging doesn't usually depend on code being debugged - it's mostly affected by configuration. Does your test app run on same server as your real app?
attract attention
test application: after start debug chrome url - localhost:3000
when real application: chrome stops on url: chrome-extension://hmhgeddbohgjknpmjagkdomcpobmllji/loading.html?url=http%3A%2F%2Flocalhost%3A3000%2F
loading doesn't work and i have to type correct url
This URL is normally displayed while application is loading and debugger is attaching. Once the server is up and running, and debugger connected, URL should change to your application URL.
If it doesn't change after a while, it likely indicates problems starting the app/attaching the debugger
It sound odd but I deleted project, created completely new and now debug works. I didn't change anything in sources only deleted .idea.
Nice to hear it works for you, thanks for letting me know!