Code analysis corruption since 2023.3

We encounter strange code analysis errors. As far as I can tell, they occur on edited code. It seems, that the code analysis gets out of sync with the actual code.
The problems happen both in java and typescript tsx files.
Tsx file warnings
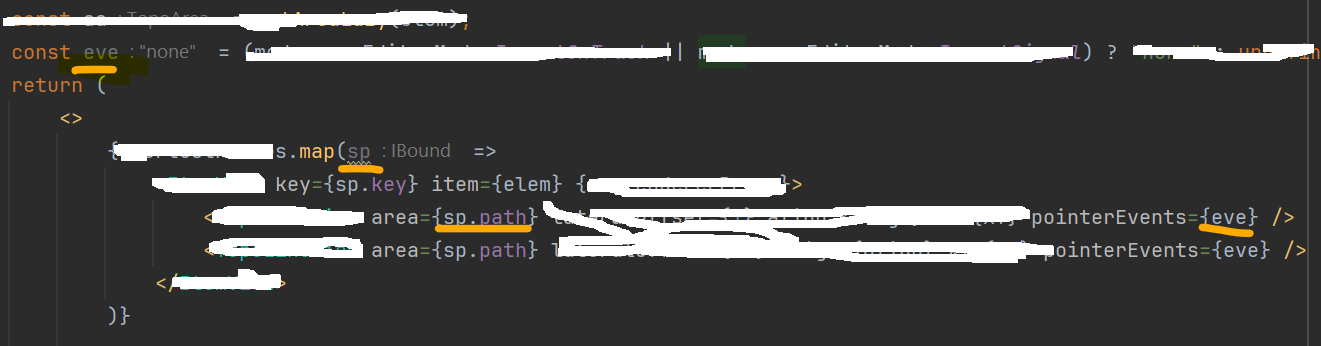
- It says eve is not in use: clearly it is used 5 lines later
- It says sp is not in use: it is accessed the very next line
Java file warnings
Prior to the screenshot, to trigger the problems, I had inserted in line 5 the assignment s = null;
This leads to the correct warnings and indications:
- lines before statement: sth like “variable is reassigned”
- lines after statement: sth like “s is always null”
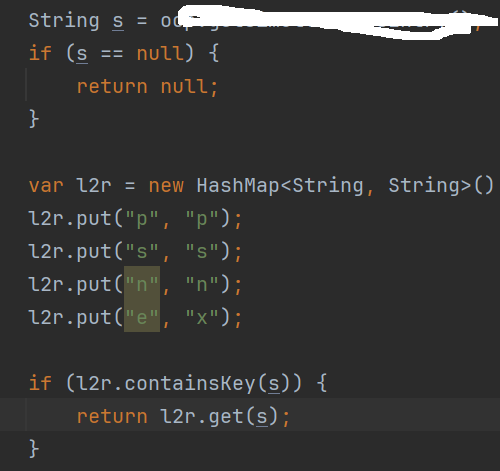
When fixing the code by removing the assigment s = null; the warnings and indications remain.
Invalidating the cache and restarting the IDE does not help, maybe for very short time. But as soon as one begins to edit, the analysis lag(?) starts again. This makes the work with the IDE very exhausting and cumbersome.
About dialog:
IntelliJ IDEA 2023.3 (Ultimate Edition)
Build #IU-233.11799.241, built on December 2, 2023
Licensed to <XXX>
Subscription is active until <XXX>, 2024.
Runtime version: 17.0.9+7-b1087.7 amd64
VM: OpenJDK 64-Bit Server VM by JetBrains s.r.o.
Windows 11.0
GC: G1 Young Generation, G1 Old Generation
Memory: 2048M
Cores: 16
Registry:
scala.erase.compiler.process.jdk.once=false
Non-Bundled Plugins:
IdeaVIM (2.7.5)
com.jetbrains.packagesearch.intellij-plugin (233.11799.196)
org.intellij.scala (2023.3.17)
org.jetbrains.plugins.docker.gateway (233.11799.244)
Kotlin: 233.11799.241-IJ
Please sign in to leave a comment.
Let's try resetting the IDE to defaults (File | Manage IDE Settings | Restore Default Settings...). It will automatically back up your current config, so it won't be lost.
This way we can make sure the issue is not caused by some plugin or corrupted file(s).
I have switched from / to New UI, but this makes no difference.
For large files, please upload it here: https://uploads.services.jetbrains.com/
I have uploaded the memory snapshot and the backup of the settings:
Upload id: 2023_12_14_nS4UKHLV2aivbcW7gUV3rg (file: IU-233.11799.300_memory_Matthias Cavigelli_14.12.2023_10.22.52.hprof)
Upload id: 2023_12_14_rmRGD81ZEk2bM5eoBfUMuo (file: 2023-12-13-11-36.zip)
https://www.jetbrains.com/help/idea/directories-used-by-the-ide-to-store-settings-caches-plugins-and-logs.html#config-directory
I have removed the disabled_plugins.txt. It seems to work better now.
Strange, that it worked before with the same plugin settings.
When changing the code to make the warnings appear, the reaction occurs within fractions of a second.
Just as a side note: when undoing these changes to make the warnings disappear, the reaction takes around 5 seconds. I am not sure, if that is within the expected time range.
Thank you for your help.