How to configure remote xdebug
HI,
after searching the web and reading all threads and articles on that topic i am kind of stuck here. (i read and teste approximately for 5 hours)
My setup:
Development remote machine: 192.168.1.238 (running latest debian with apache, samba)
Local machine: 192.168.1.203
Local machine mounts the www root of the development machine which is /var/www to z:\ on the local machine. Its a samba share.
So now i create a project and chose from mounted drive.
It copies all files to p:\WORKSPACE_PHPSTORM\TESTPROJEKTE\test-tests\
The project has only ine file index.php containing :
<?php
for($i=1; $i < 10; $i++ ) {
      print("<h3>Foo</h3>");
}
?>
On the remote server the files are in /var/www/php_scripte/tests/ and you can acce sthem by http://192.168.1.238/php_scripte/tests/index.php
I now set a breakpoint inside my for($i= .... and go to http://192.168.1.238/php_scripte/tests/index.php and klick the xdebug start session bookmarklet and reload the page
The Debugger Tab is nly showing "Waiting for incoming connection with ide key 'phpstorm'
my xdebug is correctly installed
zend_extension = /usr/lib/php5/20090626/xdebug.so
xdebug.remote_enable=1
xdebug.remote_autostart=1
xdebug.remote_port=9000
xdebug.remote_handler=dbgp
xdebug.idekey=PHPSTORM
#this ignores remote host if enabled
;xbebug.remote_connect_back=1
xdebug.remote_host=192.168.1.203
;xdebug.remote_host=127.0.0.1
;xdebug.remote_log=/var/log/apache/xdebug_remote
;xdebug.profiler_enable = 0
;xdebug.profiler_output_dir = /tmp
;xdebug.profiler_output_name = cachegrind.out.%t
;xdebug.profiler_append=1
http://screensnapr.com/v/wDnxGS.png
i am not sure what i misconfigured. i attached my logfile after the tests.
ps. i already tested the zero config option/button
Attachment(s):
idea.log.zip
servers.png
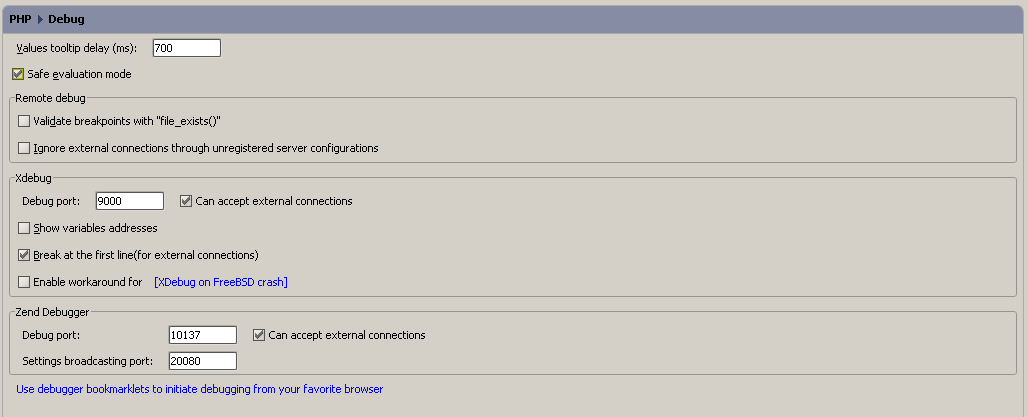
settings-debug.png
settings-remote.png
Please sign in to leave a comment.
i sniffed ports on my local machine where phpstorm is running
http://screensnapr.com/v/pWvw0L.png
its listening on 0.0.0.0 ? how should that work?
This is ok - 0.0.0.0 means ANY interface.
reporting back. zero configuration works now. after trying it until one o clock at night i gave up :) and shgut down everything, server, workstation.
today i thought well lets try it again:
create project from mounted folder ....hit the green phone button, called http://192.168.1.238/php_scripte/tests/index.php and there it is "incoming debug connection".
this time i did not even disable my workstations firewall to track whats going on. i accepted ide listening on port 9000. everything works.
a tip for other users having these problems. just shut down your workstation and reboot it (makes no sense but thats the only variable in my case that has changed over night) (or maybe my linux smurfs threatened my windows to work with them when i was sleeping :))
Marco,
Thanks for sharing!
Hello marco,
You can disable this option if you use bookmarklets/toolbar. When the option is enabled the debugger will try to connect on every request.
Please note that you don't need to use 'PHP Remote Debug' or 'PHP Web Application' run configuration when the 'Listen incoming debug connections' button is enabled.
Thank you for feedback!