debug settings xdebug / PHP Web Application / XAMPP / Zend-Framework 1.x (PHPStrom 10)

Dear Community,
I try to debug a zend-framework application with PHPStorm and XDEBUG, but it does not work: the browser starts and shows the ?XDEBUG_SESSION_START=12345, xdebug works (phpinfo()), but the debugger-tab always show "waiting for incoming connection with ide key '12345'.
I think the problem is that I have a virtual host that defines the docroot in a directory ("public") in the project directory and a DirectoryIndex set to "bootstrap.php". zend framework do the url-routing of the project and starts the bootstrap-file bootstrap.php. I wonder how should PHPStorm know the bootstrap.php is to observer. I wonder if the "use path mapping" is for this case, but I only want to configure: "All urls are processed from the bootstrap.php, independent from the url."
ok, here my settings:
vhost
<VirtualHost 127.0.0.1>
DocumentRoot "C:/webroot/audite/public"
ServerName audite
<Directory "C:\webroot\audite\public">
DirectoryIndex bootstrap.php
</Directory>
</VirtualHost>
The base directory of the project is c:\webroot\audite
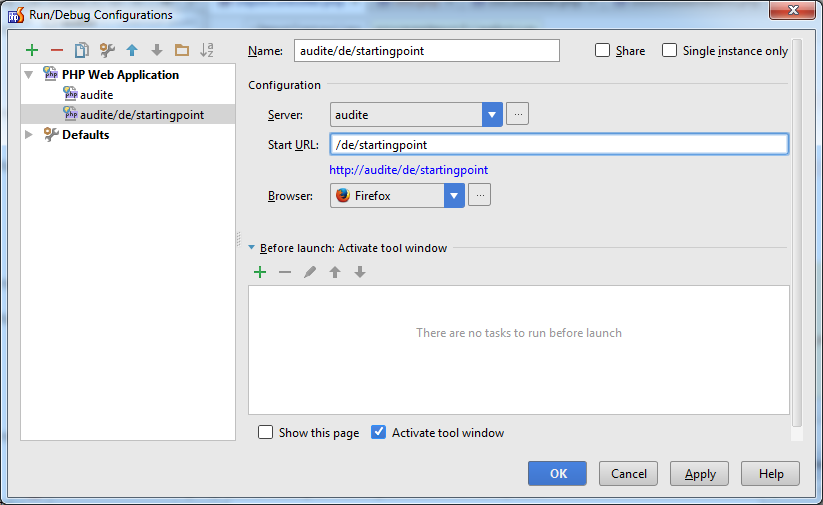
screenshots from the phpstrom settings are attached.
It would be great if anyone can help me,
all the best,
Arne
Attachment(s):
webapp.png
server.png
php.png
Please sign in to leave a comment.
Hi there,
There is no need for that at all. Debugging works with files and not URLs.
1) Please show your xdebug section of phpinfo() output captured via browser -- to make sure it's installed and configured.
2) Please provide xdebug log for such debug session. Maybe it did not even started -- http://xdebug.org/docs/all_settings#remote_log
3) Please place breakpoints on simple statements (single line). Breakpoint may fail or complex or multiline statements (PHP nuances)
4) Try adding xdebug_break(); in your code (programmatic breakpoint) -- but for this you have to have "phone handle" icon to be active
Some links:
Dear Andry,
I'm so sorry, sorry, sorry. It was a xdebug missconfiguration. the xdebug-section was predefined from xampp, i have left it, and the profiler simply was not enabled. :( I have searched three hours. Sorry again for my post and your time to answer it.