Trouble setting up debug
I'm following these instructions;
http://www.jetbrains.com/phpstorm/webhelp/configuring-xdebug.html
to get debugging working with XDebug. I've gotten to the part titled Integrating XDebug with PhpStorm. I get to step three, but there is not XDebug listed in the Debugger drop-down list.
How do I troubleshoot this?
Thanks,
Bernie
Please sign in to leave a comment.
Hi there,
Screenshot please.
Most likely you are on the wrong screen as that drop-down box has always had 2 entries (they are hardcoded).
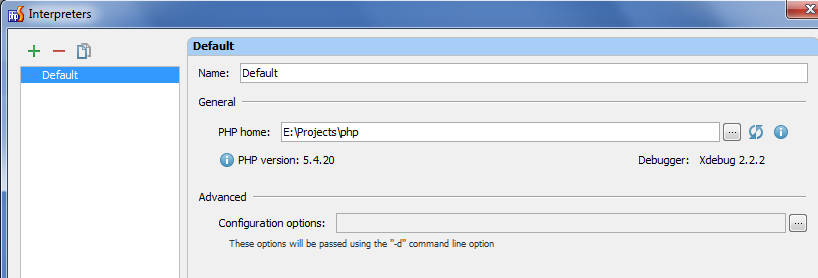
Here's the screen shot showing the dialog and the parent dialog and main program in the background.
Attachment(s):
screen.png
You need to click on green "plus" button to add an interpreter -- the debugger engine will be detected automatically.
P.S.
The place where you can choose what debugging engine to use is located at "Settings | PHP | Servers" -- used by Run/Debug Configurations
P.P.S.
Check out this video in case you have not seen it yet: http://blog.jetbrains.com/phpstorm/2013/07/webinar-recording-debugging-php-with-phpstorm/
Other various useful articles/videos can be found here: