IJ Remote Dev hogs CPU and RAM trying to "Save <project> settings"

I have been doing the same project on the same machine. Client is Kubuntu, host is a Debian 13 local server (within LAN) with Intel i5-8500T and 16GB RAM. IJ version 2025.3.2 on both.
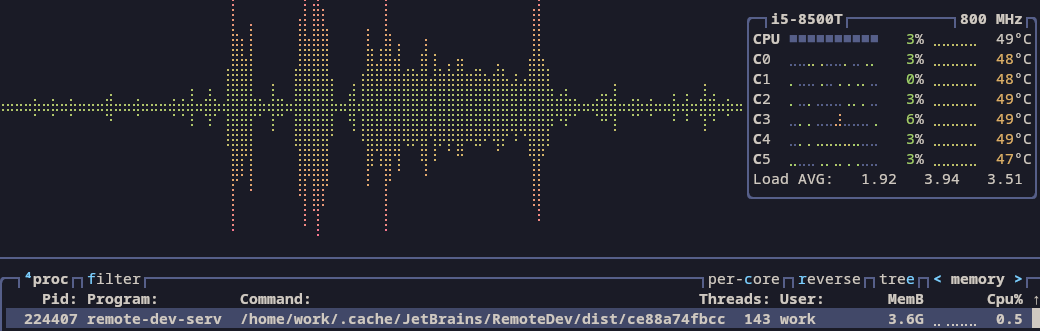
The project has been getting pretty big, and suddenly today, it starts trying to eat all the RAM and CPU at random timestamps. Idling is very low for the remote dev server, only at around 3G and 0-5% CPU consumption. Whenever this happens, it 100% all 6 cores on host, and take up to 8GB.
After debugging for a while, the problem seems to be from the IDE trying to execute some background task of “Save <project name> settings”. This process seems to be not controllable, even on cancel it would just self revive a few minutes later. The impact was so hard that the IDE constantly report low memory and sometimes even disconnect itself because host is unresponsive.
Some reported issue said it has something to do with Island Dark theme, but this is probably not the case here since it's on backend and not frontend.

On idle:
Please sign in to leave a comment.
Thank you for the details. I think your case is similar to the following one we are currently investigating:
https://youtrack.jetbrains.com/issue/IJPL-234247
1. Check your .idea/workspace.xml size — how big is it? Is it growing after every save activity?
2. How many Run Configurations do you have?
As a workaround, try unchecking everything in Settings | Appearance & Behavior | System Settings | Autosave section and let me know if it helps.
If possible, please attach your workspace.xml file to the issue above. Logs and thread dumps from the backend IDE are also highly appreciated. Here is how to collect the diagnostics:
https://www.jetbrains.com/help/idea/remote-development-troubleshooting.html#support
https://youtrack.jetbrains.com/articles/SUPPORT-A-1701
This will help us investigate the problem. Thanks!
https://chibi.minhperry.de/TJ5WXjgxoJTV.zip Log
The issue is not available to view for me.
The IDE seems to not hang anymore, but is still aggresively using RAM and CPU
Unfortunately, I can’t change the visibility of this issue. Could you please attach a CPU snapshot from the backend as well, so we can create a separate one? (Help | Diagnostic Tools | Start CPU Usage Profiling (On Host) -> wait a few minutes -> Help | Diagnostic Tools | Stop CPU Usage Profiling (On Host)). More on that:
https://youtrack.jetbrains.com/articles/SUPPORT-A-1705/Reporting-performance-problems#the-cpu-usage-is-high-or-ide-is-slow