Debugging in WebStorm with WebPack source maps produces strange errors that don't appear in non WS-launched Chrome instance
I'm trying to debug a Node/React application using WebStorm. The application uses Node to mount a server which serves already built React .js files. So in order to debug the front end using the original source code I need to produce source maps. This is the first time I've done this.
I modified the existing scripts to produce one that will produce source maps:
package.json
"build:dev": "cross-env NODE_ENV=development webpack --config internals/webpack/webpack.dev.babel.js --color -p --progress",
webpack.dev.babeljs
// Emit a source map for easier debugging
devtool: 'inline-source-map',
Then I set up configurations in WebStorm to debug Node and React at the same time. I get a series of errors in the WebStorm debugger console:
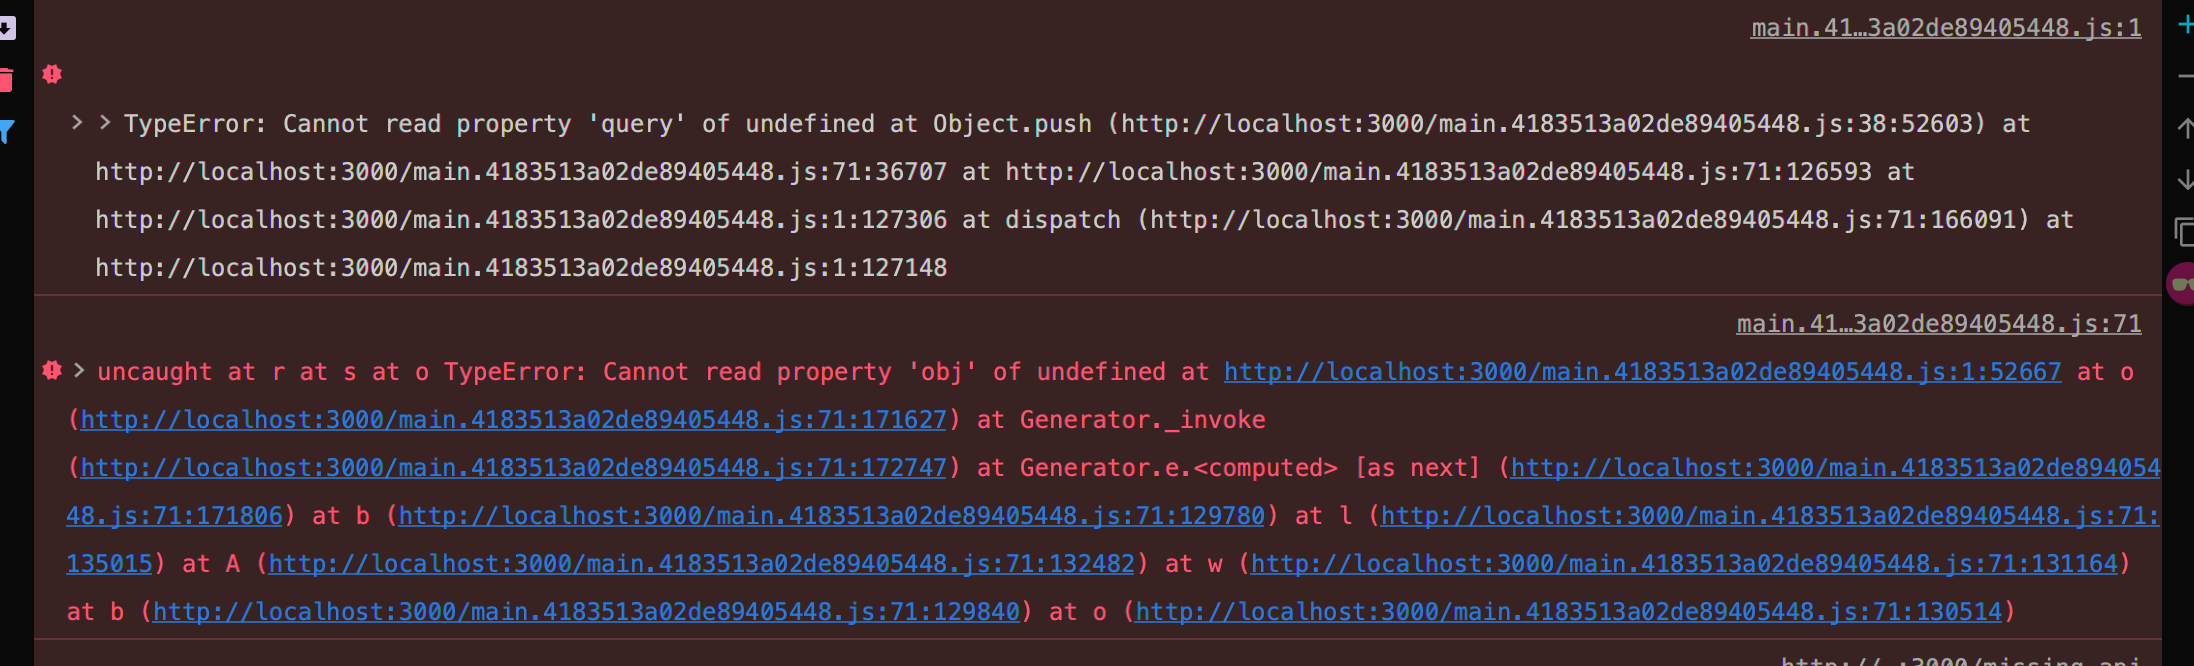
These also appear in the console of the Chrome instance launched by WebStorm.
However if I go to separate Chrome instance these errors _don't_ appear in the console: the page loads fine.
WebStorm 2019.2.4, MacOS 10.14.5, Node 12.13.0. Any help much appreciated -- I'm at a loss.
Please sign in to leave a comment.
doesn't look like IDE issue...
Can you share a project it can be reproduced with?
No, unfortunately I can't -- it's proprietary. I would think it's not an IDE issue, except that these errors only appears in the console of the instance of Chrome launched by WebStorm. Even while the application is running under the 'control' of WebStorm's debugger, if I go to another instance of Chrome, the errors don't appear in that console.
I can hardly help unfortunately unless i have a project to play with.
None of projects I've tried exhibit similar issues