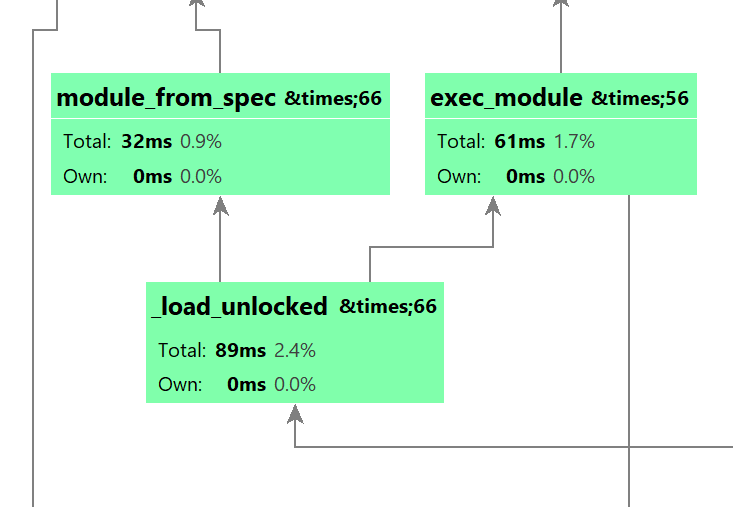
Thanks for the link. The issue however is not quite identical - some attempt seems to have been made to correct the problem since the first issue was posted, since previously it was a typing error (a missing &). Now that error has been corrected and the HTML entity is well-formed, but it is still being rendered as plain text.
Hi,
Please see https://youtrack.jetbrains.com/issue/PY-41377
We can probably consider it a duplicate.
Thanks for the link. The issue however is not quite identical - some attempt seems to have been made to correct the problem since the first issue was posted, since previously it was a typing error (a missing &). Now that error has been corrected and the HTML entity is well-formed, but it is still being rendered as plain text.
You may be right. Since now it's not "Just cosmetic", but seems to be a legit bug, I've created a new issue: https://youtrack.jetbrains.com/issue/PY-46179