Debugger thinks the code is further along than where it is actually breaking - windows WSL
I'm working on the same NextJS project on two different computers - one macOsx and one Windows WSL. Debugging works as expected on mac, but on windows wsl it's not breaking at the right line.
Actually, it does seem to technically break at the right line, but the debugger highlights a different line, and jumps into functions before they are actually executed. It's like the debugger thinks the code is further along than it actually is.
Here's an example:
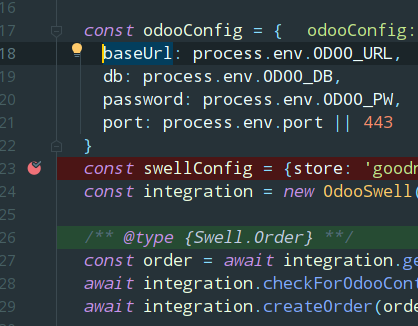
The variable at the red dot is still undefined, since that's where the line break should be. But the debugger thinks it's a few lines down the page. If click "step over", the green line jumps 3 more lines down, even though the code is actually executing a few lines back.
The same project debugs fine on my mac.
I have tried deleting all break points from the .`/.idea/workspace.xml` file but when I set a new breakpoint I still had the same problem.
How can I troubleshoot this?
Please sign in to leave a comment.
Is it all about the line being highlighted (i.e. does stepping, etc. work as expected, just the highlighted line is 3 lines 'off' always)? Also, what run configuration do you use for debugging?
No, it acts whacky and jumps into functions that aren't executing and sometimes just stops working all together and code stops executing.
I am using:
In my package.json and running npm run dev. This is the standard method to debug NextJS apps.
Again, it works fine on my mac so I don't think I'm configuring anything incorrectly.
Hmm... I wonder how it works at all when using this setup...
NODE_OPTIONSenvironment variable is used by the debugger for automatic connection to child processes, so, to get the debugging work, you have to avoid rewritingNODE_OPTIONSvariable, the debugger won't attach to child processes otherwise. What Node.js interpreter do you use? Please share a screenshot of your run configurationI must note that issues like yours are usually caused by inaccurate sourcemaps, we aren't aware of any WSL-specific cases similar to this one
Just tested this on WSL (using
+ the Attach to Node.js/Chrome run configuration with the port
9229as suggested in https://nextjs.org/docs/advanced-features/debugging#server-side-code) - debugging works as expected, it's breaking on the right lines in both the client- and server-side codeThe instructions you posted a link to are specifically for debugging in Chrome, not in webstorm.
Debugging in webstorm works in most of my projects. This one specifically is giving me problems. I've tried the following:
1. Deleting the dev folder to force a rebuild of source maps
2. Reinstall all packages
3. Built the project with 'next build'
4. Deleted breakpoints in the worspace.xml
None of those solve the issue, and the debugger continues to break on the wrong lines, 3-4 lines beyond the correct line. This can cause issues especially when I have breakpoints in multiple files, as the debugger thinks it's in a different file and I can't examine the correct variables.
I would love to hear any further suggestions as to what I can try to get this functioning properly. Thank you
I can hardly advise unless I have a project to play with:( As I wrote, such issues are typically caused by wrong sourcemaps; when setting up webpack, you need to make sure that the sourcemaps quality is
original(ororiginal linesat least) to make debugging workWhen I posted the last comment regarding steps I've tried to resolve, I realized I hadn't tried restarting my workstation.
After restarting, everything is operating as expected now. Thanks for your help and sorry about that.
The issues reoccurred and persisted. After trying a number of things, upgrading my Ubuntu distro on wsl 2 from 18.04 to 20.04 ultimately resolved the issue. Just posting this here in case anyone else has a similar issue.