Profiler not acting as expected on PyCharm - no drill down

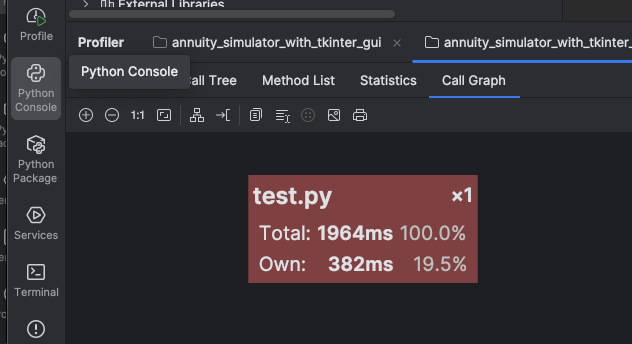
When I run profiler on a script it currently only shows me a single node without any detail:
or something like:
In the past when I would Profile code, it would drill down into those nodes to show the amount of time spend on each loop or call to various modules and primatives contained in them.
For example. ‘test.py’ is the following:rng = np.random.default_rng(seed)dt = 1.0 / n_stepsN = int(T * n_steps) # total number of steps# Pre‑compute drift and diffusion per stepdrift = (mu - 0.5 * sigma**2) * dtdiffusion = sigma * np.sqrt(dt)# Simulate all paths at once (memory‑wise: N * n_paths floats)# For very large n_paths you may want to loop in batches.# Here we keep it simple.Z = rng.standard_normal(size=(n_paths, N))log_increments = drift + diffusion * Zlog_prices = np.cumsum(log_increments, axis=1)log_prices = np.hstack([np.zeros((n_paths, 1)), log_prices]) # include S0 at t=0prices = S0 * np.exp(log_prices)# Did the path ever go below B?hit = np.any(prices <= B, axis=1)prob_mc = hit.mean()
And in the past if I were to profile something like this it would show me how much of the 1964ms for ‘test.py’ were spent on items like Z = rng.standard_normal(size=(n_paths, N)) or log_prices = np.cumsum(log_increments, axis=1) and drill down in the the various bits and pieces it would call so that it would show a detailed tree below the ‘test.py’ node for all the various bits and piece allowing me to identify the hot spot?
for example np.cumsum() might tree down to some sort of gather primative or whatever and I'd end up with a big tree showing me how all 1964 milliseconds where allocated to different pieces.
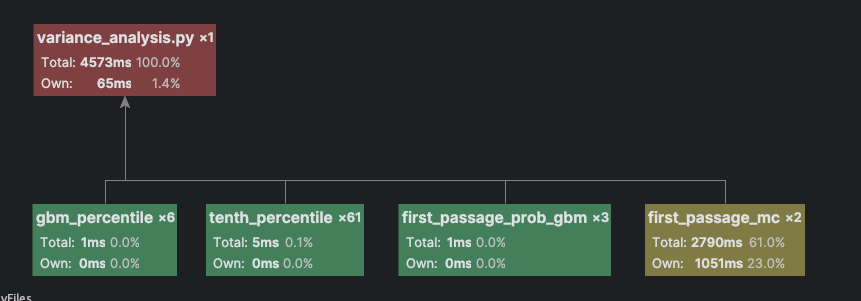
Now I'm just geting the aggregate time for either the entire script in the case of my ‘test.py’ above or for each of the methods as a whole such as ‘def first_passage_mc()’ = 2790 rather than then building a tree below the ‘first_passage_mc’ showing me how the various bits of code in it accounted for the 2790 ms.
I ran it with ‘cProfiler’ and it show absolutely nothing in the ‘profiler’ results, even though I saw a “.pstat” file in the approriate directory. I then installed ‘yappi’ which is what created the profile above?
What am I doing wrong?? I want a detailed profile that drills all the way down the the base primitives. I don't use profiling much, so I don't know when it changed or my configuration changed, but I definitely used to get ‘drill down’s when running the profiler.
I'm currently on PyCharm 2025.2.1.1. I feel like when I was on earlier versions from prior years it worked with the drill-down. Hopefully I just have a setting wrong??
请先登录再写评论。
Hi Phillip Glau, as a general troubleshooting step, and to avoid handling already resolved issues, please try updating to the latest 2025.2.4 version and check whether the problem persists.
If it still occurs, please create an issue in YouTrack (https://youtrack.jetbrains.com/issues/PY) Include all relevant details (steps to reproduce, PyCharm/OS versions, screenshots or a short recording, and a minimal project sample) to help us investigate quickly.