Debugging Javascript assets in a Rails app - Local vs actual source confusion
I have made a basic rails 4.2.10 app. Just generated a model for "person" with a field "name" string. See https://github.com/jayjlawrence/i_am_happy
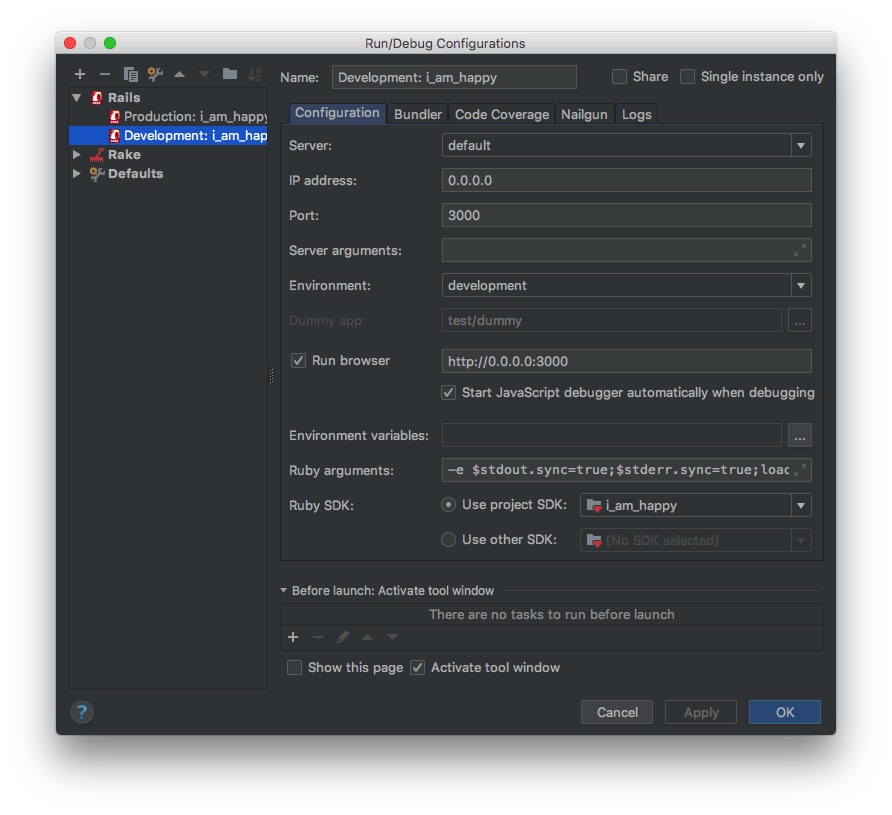
Running RubyMine 2018.1.3. I have a run configuration as shown:
 When I debug this project I expect that I should be able to place a breakpoint in my javascript like this:
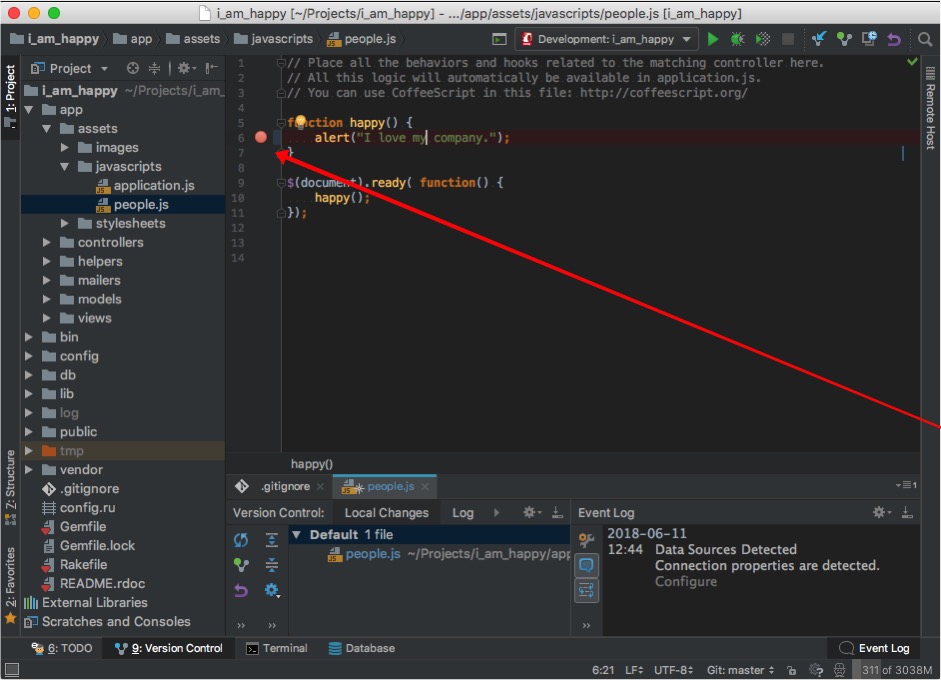
When I debug this project the breakpoint is not recognized and the source file actually used is the asset that's generated. "people.self-####.js". If I set a break point in the generated asset then this works but that's not a very satisfying situation.
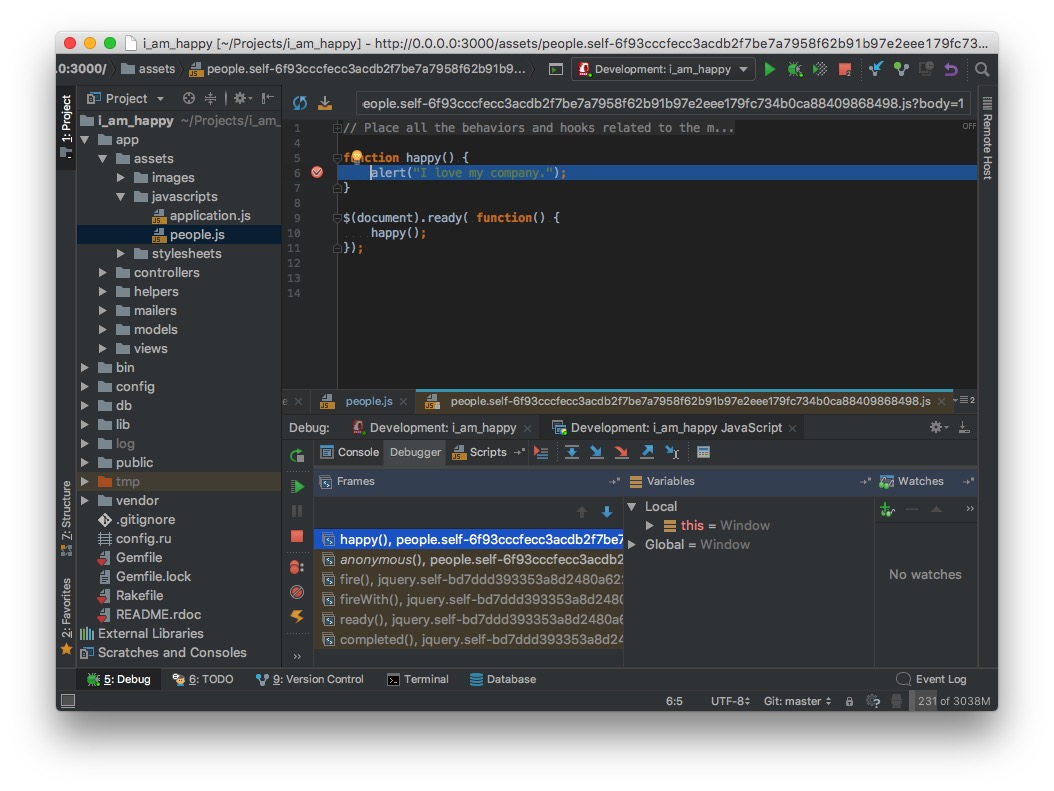
This is it working ...
 If I specify the local path like this:

I doesn't work. Still uses break point from "pepole.self-####.js" but doesn't open that source when the breakpoint is open.
WHAT AM I MISSING HERE????
请先登录再写评论。
So this issue has really bugged me. I kept at it off and on today.
I missed (and so did JetBrains by looking through their documentation) an important detail:
The settings for 'development.rb' I have settled on for now are:
Then when you fire up the debug session:
To debug the "people.js" file do this ...
Select the specific file:
Then debug ...
Success ... and apparently I do love my company ... but today I'm not 100% happy with either it nor JB ... this should be explained more clearly in the documentation. Especially since it is quite a unique feature compared to other dev environments -> a compelling and competitive product differentiator!
Even better - for anyone who's reading this ... here's what you need to do:
1) do not use the integrated Javascript debugger feature for a rails project.
2) Instead create a separate JavaScript debugging project.
3) There you can clearly make the source code linkages, they are clearly visible, you can edit and most importantly, they are saved!
Above, connecting the published file "people.self.js" to the actual source which is just people.js under app/assets/javascript
You would think that adding a run-before task to spin up your rails app would work. Unfortunately rails app has to exit and cannot run in parallel.
About this approach:
pros
- it appears to make javascript debugging much more feasible
- you control exactly what sources are looked at when
cons
- clunky and there's no automatic mapping from source to published asset
- reference materials (and support) are AWOL
- have to launch two run configurations
But least its getting quite close to the goal I am seeking - easier javascript debugging.
Hello Jay,
thank you very much for providing detailed steps of your setup. At the moment there's indeed problem with automatic mapping but we plan to fix that in the next release (2018.3), please follow the corresponding issue:
https://youtrack.jetbrains.com/issue/WEB-30293