phpinfo() discrepancies

I experiencing an issue getting zero configuration debugging working with PHPStorm. I have followed all of the documentation in regards to setting this up. I have setup my CLI Interpreter using PHP 7.1.12 and using Xdebug 2.6.0. I have configured php.ini with the zend_extention and pointed it to my xdebug.so path. I have also configured php.ini with the following:

xdebug.remote_enable=1
xdebug.remote_connect_back=1

When I view phpinfo in my browser it shows the correct values:

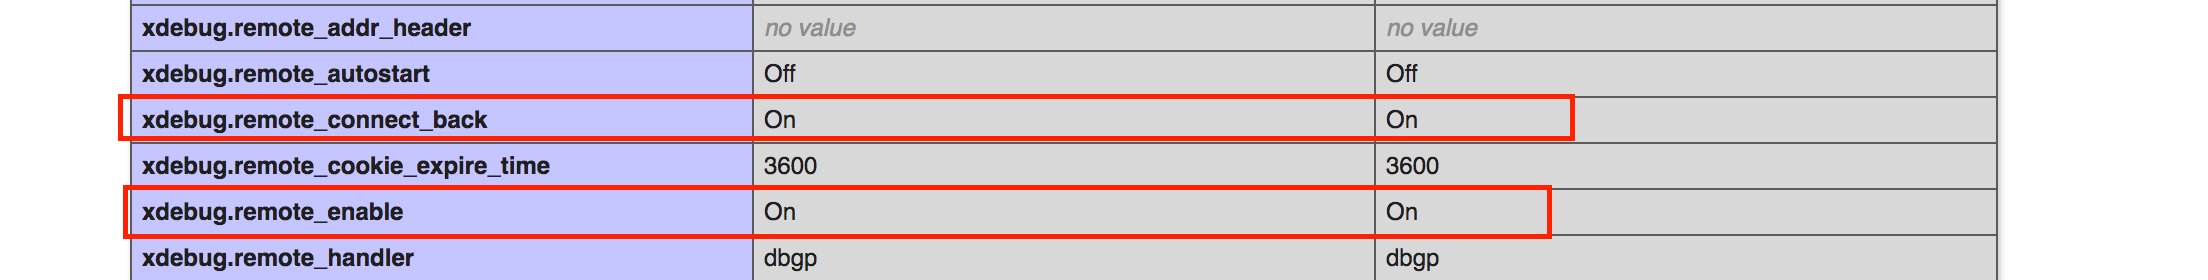
But when I view phpinfo in PHPStorm it shows an incorrect value for xdebug.remote_enable:

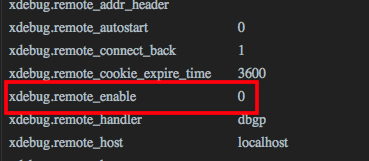
I have ensured that I have restarted my web stack as well as tested other versions of PHP and xdebug with no luck. Debugging is not working.

Any help would be appreciated.

0

Hi there,

What is your OS?

Thing is: on Linux/Mac it's quite common these days to see separate php.ini for CLI and Apache. So ... check "php --ini" or phpinfo() header to see what php.ini files were used.

P.S. For CLI debug, especially if it's initiated from IDE, PhpStorm will add all needed options anyway .. so it's not super critical (unless we are talking about more/different settings).

P.P.S. I have seen setups where xdebug.remote_enable was constantly showing "0" in PhpStorm but debug was still working...

1
Avatar
Permanently deleted user

Thanks for your response,

I ran php --ini and got back this:

I'm not sure where to find the phpinfo() header.

I'm not attempting to use CLI debug at the moment. I have installed the xdebug helper extension for chrome.

I've also validated my debug configuration and got back this:

When I fire up the xdebug helper and activate PHPStorm's debug listening I'm not getting anything back. I'm not sure where to go from here.

Thanks,

-Adam

0

>I'm not sure where to find the phpinfo() header.

At the very top / first table.

>When I fire up the xdebug helper and activate PHPStorm's debug listening I'm not getting anything back. I'm not sure where to go from here.

1. Collect xdebug log -- it should tell what's happening (if it tries to connect and where)

2. Better change xdebug port to be 9001 (in both php.ini and PhpStorm) -- 9000 is also used by php-fpm by default .. so it may connect there instead of IDE (if you have php-fpm installed, of course; which you may have without knowing it).

3. With "phone handle" icon enabled in PhpStorm -- check what app is actually listening on 9000 port, e.g. sudo lsof -nP -iTCP -sTCP:LISTEN

4. In general (in case you have not seen it yet): https://confluence.jetbrains.com/display/PhpStorm/Debugging+with+PhpStorm

1
Avatar
Permanently deleted user

Thanks for the info. I have implemented your suggestions with some success but I'm still not seeing the debug panel in PHPStorm. I've enabled xdebug logging as well as PHPStorm logging.

Xdebug:

Log opened at 2018-03-21 17:58:39
I: Checking remote connect back address.
I: Checking header 'HTTP_X_FORWARDED_FOR'.
I: Checking header 'REMOTE_ADDR'.
I: Remote address found, connecting to 127.0.0.1:9001.
I: Connected to client. :-)
-> <init xmlns="urn:debugger_protocol_v1" xmlns:xdebug="http://xdebug.org/dbgp/xdebug" fileuri="file:///Users/{user}/acquia/{application}/docroot/index.php" language="PHP" xdebug:language_version="7.1.12" protocol_version="1.0" appid="46590" idekey="PHPSTORM"><engine version="2.6.0"><![CDATA[Xdebug]]></engine><author><![CDATA[Derick Rethans]]></author><url><![CDATA[http://xdebug.org]]></url><copyright><![CDATA[Copyright (c) 2002-2018 by Derick Rethans]]></copyright></init>

<- feature_set -i 1 -n show_hidden -v 1
-> <response xmlns="urn:debugger_protocol_v1" xmlns:xdebug="http://xdebug.org/dbgp/xdebug" command="feature_set" transaction_id="1" feature="show_hidden" success="1"></response>

<- feature_set -i 2 -n max_depth -v 1
-> <response xmlns="urn:debugger_protocol_v1" xmlns:xdebug="http://xdebug.org/dbgp/xdebug" command="feature_set" transaction_id="2" feature="max_depth" success="1"></response>

<- feature_set -i 3 -n max_children -v 100
-> <response xmlns="urn:debugger_protocol_v1" xmlns:xdebug="http://xdebug.org/dbgp/xdebug" command="feature_set" transaction_id="3" feature="max_children" success="1"></response>

<- feature_set -i 4 -n extended_properties -v 1
-> <response xmlns="urn:debugger_protocol_v1" xmlns:xdebug="http://xdebug.org/dbgp/xdebug" command="feature_set" transaction_id="4" feature="extended_properties" success="1"></response>

<- status -i 5
-> <response xmlns="urn:debugger_protocol_v1" xmlns:xdebug="http://xdebug.org/dbgp/xdebug" command="status" transaction_id="5" status="starting" reason="ok"></response>

<- step_into -i 6
-> <response xmlns="urn:debugger_protocol_v1" xmlns:xdebug="http://xdebug.org/dbgp/xdebug" command="step_into" transaction_id="6" status="break" reason="ok"><xdebug:message filename="file:///Users/{user}/acquia/{application}/docroot/index.php" lineno="17"></xdebug:message></response>

<- eval -i 7 -- aXNzZXQoJF9TRVJWRVJbJ1BIUF9JREVfQ09ORklHJ10p
-> <response xmlns="urn:debugger_protocol_v1" xmlns:xdebug="http://xdebug.org/dbgp/xdebug" command="eval" transaction_id="7"><property type="bool"><![CDATA[0]]></property></response>

<- eval -i 8 -- aXNzZXQoJF9TRVJWRVJbJ1NFUlZFUl9OQU1FJ10p
-> <response xmlns="urn:debugger_protocol_v1" xmlns:xdebug="http://xdebug.org/dbgp/xdebug" command="eval" transaction_id="8"><property type="bool"><![CDATA[1]]></property></response>

<- eval -i 9 -- KHN0cmluZykoJF9TRVJWRVJbJ1NFUlZFUl9OQU1FJ10p
-> <response xmlns="urn:debugger_protocol_v1" xmlns:xdebug="http://xdebug.org/dbgp/xdebug" command="eval" transaction_id="9"><property type="string" size="30" encoding="base64"><![CDATA[aW50cmFuZXQucGhhcm1hY3kudWlvd2EuZWR1LmRk]]></property></response>

<- eval -i 10 -- KHN0cmluZykoJF9TRVJWRVJbJ1NFUlZFUl9QT1JUJ10p
-> <response xmlns="urn:debugger_protocol_v1" xmlns:xdebug="http://xdebug.org/dbgp/xdebug" command="eval" transaction_id="10"><property type="string" size="4" encoding="base64"><![CDATA[ODA4Mw==]]></property></response>

<- eval -i 11 -- KHN0cmluZykoJF9TRVJWRVJbJ1JFUVVFU1RfVVJJJ10p
-> <response xmlns="urn:debugger_protocol_v1" xmlns:xdebug="http://xdebug.org/dbgp/xdebug" command="eval" transaction_id="11"><property type="string" size="1" encoding="base64"><![CDATA[Lw==]]></property></response>

<- run -i 12
-> <response xmlns="urn:debugger_protocol_v1" xmlns:xdebug="http://xdebug.org/dbgp/xdebug" command="run" transaction_id="12" status="break" reason="ok"><xdebug:message filename="file:///Users/{user}/acquia/{application}/docroot/sites/{site}/themes/{sub_theme}/includes/page.inc" lineno="20"></xdebug:message></response>

<- run -i 13
-> <response xmlns="urn:debugger_protocol_v1" xmlns:xdebug="http://xdebug.org/dbgp/xdebug" command="run" transaction_id="13" status="stopping" reason="ok"></response>

<- stop -i 14
-> <response xmlns="urn:debugger_protocol_v1" xmlns:xdebug="http://xdebug.org/dbgp/xdebug" command="stop" transaction_id="14" status="stopped" reason="ok"></response>

Log closed at 2018-03-21 17:58:40

Here are the relevant PHPStorm logs (idea.log):

2018-03-21 13:03:00,941 [ 311539] INFO - lij.diagnostic.DebugLogManager - Set DEBUG for the following categories: #com.jetbrains.php, #com.jetbrains.plugins.webDeployment, #com.intellij.ssh 
2018-03-21 13:03:14,739 [ 325337] DEBUG - il.connection.ServerConnection - Incoming connection on port 9001 from 127.0.0.1
2018-03-21 13:03:14,742 [ 325340] DEBUG - .connection.PhpDebugConnection - 742409308#----connection started
2018-03-21 13:03:14,755 [ 325353] DEBUG - .connection.PhpDebugConnection - 742409308#---Start detaching
2018-03-21 13:03:15,456 [ 326054] DEBUG - .connection.PhpDebugConnection - 742409308#---input stream is finished
2018-03-21 13:03:15,456 [ 326054] DEBUG - .connection.PhpDebugConnection - 742409308#---stop reading
2018-03-21 13:03:15,456 [ 326054] DEBUG - .connection.PhpDebugConnection - 742409308#---stop writing
2018-03-21 13:03:15,456 [ 326054] DEBUG - .connection.PhpDebugConnection - 742409308#----connection stopped
2018-03-21 13:03:15,456 [ 326054] DEBUG - .connection.PhpDebugConnection - 742409308#---Stop detaching
2018-03-21 13:03:15,457 [ 326055] DEBUG - il.connection.ServerConnection - ----socket closed
2018-03-21 13:03:15,495 [ 326093] DEBUG - il.connection.ServerConnection - Incoming connection on port 9001 from 127.0.0.1
2018-03-21 13:03:15,497 [ 326095] DEBUG - .connection.PhpDebugConnection - 932979019#----connection started
2018-03-21 13:03:15,521 [ 326119] DEBUG - .connection.PhpDebugConnection - 932979019#---Start detaching
2018-03-21 13:03:16,053 [ 326651] DEBUG - .connection.PhpDebugConnection - 932979019#---input stream is finished
2018-03-21 13:03:16,053 [ 326651] DEBUG - .connection.PhpDebugConnection - 932979019#---stop writing
2018-03-21 13:03:16,054 [ 326652] DEBUG - .connection.PhpDebugConnection - 932979019#---stop reading
2018-03-21 13:03:16,054 [ 326652] DEBUG - .connection.PhpDebugConnection - 932979019#----connection stopped
2018-03-21 13:03:16,054 [ 326652] DEBUG - .connection.PhpDebugConnection - 932979019#---Stop detaching
2018-03-21 13:03:16,054 [ 326652] DEBUG - il.connection.ServerConnection - ----socket closed


0

I do not know where your message has disappeared (it's not currently showing .. maybe on moderation) ... but from what I saw you had a successful debug session (at very least from communication point of view) -- Xdebug connected to IDE just fine.

Do you have any symbolic links in the project path?

What file have you tried to debug? Were there any breakpoints set? Any IDE popups (like "This session has finished without hitting any breakpoint" etc)?

TBH -- a screencast with details would be great here.

1
Avatar
Permanently deleted user

Sorry I made some edits to obfuscate some paths. The comment states "pending approval".

> Do you have any symbolic links in the project path?

Yes there is a symlink within the project.

> What file have you tried to debug? Were there any breakpoints set? Any IDE popups (like "This session has finished without hitting any breakpoint" etc)?

I have set a breakpoint as well as implemented xdebug_break(). I do not get any messages in Event Log.

I can try to put together a screencast if that would help.

Thanks

0

>Yes there is a symlink within the project.

In such case you need to setup the right path mapping so IDE can map real path (after PHP/xdebug resolves it) to what IDE sees. Without correct path ... the breakpoint gets set for a file that is not getting executed (from PHP point of view).

That's, of course, if you have not done it already -- "Settings/Preferences | Languages & Frameworks | PHP | Servers"

1
Avatar
Permanently deleted user

@Andriy thank you for your help. The server configuration was exactly what I needed. Thanks again!

0

请先登录再写评论。