I can't attach CPU profiler
已回答
I've added VM option
-agentlib:yjpagent64=delay=10000,probe_disable=*
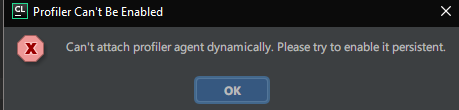
and clicked Help | Diagnostic | Enable CPU Profiler but the message "Profiler Can't Be Enabled" came out.
I'm using CLion on Windows 10 x64. How to I attach the profiler?
请先登录再写评论。
Hi! The Performance Testing plug-in is supported only for IntelliJ IDEA and PhpStorm at the moment.
If you've added
-agentlib:yjpagent=delay=10000,probe_disable=*to the .vmoptions file, you should have theTools | Start CPU Usage Profilingmenu option in CLion. In order to capture a CPU snapshot you need to click onStart CPU Usage Profilingand then perform the actions which are causing performance problems (try to reproduce the performance problem several times while the snapshot is being recorded), then click on theTools | Stop CPU Usage Profilingto save the snapshot file (snapshot is saved in the user home directory and IDE will show a notification with the exact file name, the extension of the file is .zip).Thanks for reply. Now it works well.
But Help | Diagnostic | Enable CPU Profiler in IntelliJ IDEA makes same error message, even though Performance Testing plugin is installed in IntelliJ by default.
What is the problem? Is Windows not supported?
Hello,
Please report new request on YouTrack attaching idea.log ("Help | Show Log in...") after restarting IDE and reproducing the issue: http://youtrack.jetbrains.com/issues/IDEA.
Probably, it's blocked by antivirus software.