Using Xdebug with phpstorm
I'm trying to configure everything to be able to use xdebug with PhpStorm.
So far, I failed, so I'm here for some help
This is my php.ini content
[xdebug]
zend_extension="/usr/lib/php/20170718/xdebug.so"
xdebug.remote_enable=1
xdebug.remote_port="9000"
I have the xDebug item on my chrome navigator after installing the extension.
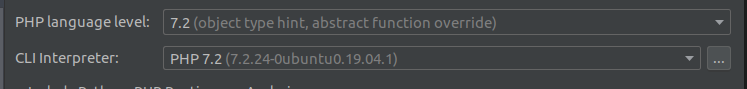
In my phpstorm settings the php and cli are set.
Of course xDebug is well activated on my php
php -v
PHP 7.2.24-0ubuntu0.19.04.1 (cli) (built: Oct 24 2019 11:49:39) ( NTS )
Copyright (c) 1997-2018 The PHP Group
Zend Engine v3.2.0, Copyright (c) 1998-2018 Zend Technologies
with Xdebug v2.8.0, Copyright (c) 2002-2019, by Derick Rethans
with Zend OPcache v7.2.24-0ubuntu0.19.04.1, Copyright (c) 1999-2018, by Zend Technologies
And the phpstorm port for xdebug is configured to 9000.
Still after doing all that when I start listenning to connection nothing happens.
What am I missing here ?
Thanks for your assistance
请先登录再写评论。
Hi there,
1) What's your IDE version
2) Show your actual (live) Xdebug settings (Xdebug section from phpinfo() output)
3) Enable and provide Xdebug log for such unsuccessful debug session -- it will tell if it tries to connect and where etc.
Thus far: you are on Linux and therefore I suggest to change port to 9001 or some another (in both IDE and php.ini) as 9000 is also used by php-fpm by default and you may have it installed and running.
Hi,
thanks for your reply.
1- The version is Phpstorm 2019.3
2 - I'm not sure how I can show you the phpinfo content. I'm not using anything like wamp just the basic installation of apache/php.
If I try to reach localhost/phpinfo.php then I will just have a 404 not found from my project.
3 - Where can I enable these logs and where I find them later ?
I will try to change the default port to 9001.
>I'm not sure how I can show you the phpinfo content. I'm not using anything like wamp just the basic installation of apache/php.
A screenshot of that section of the page will be just fine. (e.g. just like other ppl do: https://stackoverflow.com/q/59059872/783119)
>If I try to reach localhost/phpinfo.php then I will just have a 404 not found from my project.
Try another file / the file where PHP code gets executed OK and put that command there.
>Where can I enable these logs and where I find them later
xdebug.remote_log option -- https://xdebug.org/docs/all_settings#remote_log
Accordingly to your screenshot you still have xdebug.remote_enable = off. It needs to show "On".
What php.ini file have you edited? On Linux it's common to have different config files for CLI and Apache. Check phpinfo() output for that info -- it will be in the very first table.
In any case: check https://www.jetbrains.com/help/phpstorm/debugging-with-phpstorm-ultimate-guide.html and https://www.jetbrains.com/help/phpstorm/troubleshooting-php-debugging.html
I have made the modification in the cli/php.ini
The port number is wrong too I should be on 9001.
>I have made the modification in the cli/php.ini
So you have edited the wrong file. Edit the one used Apache/your web server.
You right damn it.
But this is some kind of strange, yesterday I made that modification in first in the apache php too, that sounded more logic to me. But doing php -v xdebug wasn't shown as enabled. I had to put it into the cli one in order to activate it in the php -v.
I might have fucked up something at that moment. Anyway it's working fine now. Thank you very much.
>php -v
That command is executed in terminal, so it's a CLI environment (CLI = Command Line Interface). So it's expected with such "one php.ini for CLI and another for Apache" setup.
Run "php -i" and you will see what config file it uses. Run phpinfo(); via web browser and it will show different config file.