Webstorm Ubuntu NodeJS and Java overload RAM

Hey Guys,
I switched to Ubuntu(22.04) for my working laptop and since I use Webstorm here aswell some ubuntu specific problems semms to occur, the longer i have Webstorm running the more RAM uses the Java process and the NodeJs process are starting to stack up each other.
After a while the UI Freezes and my whole laptop is on 100% RAM and 100% CPU till it kills the webstorm proccess after a while and then it's fine again for a while.
Screenshot after a while running:
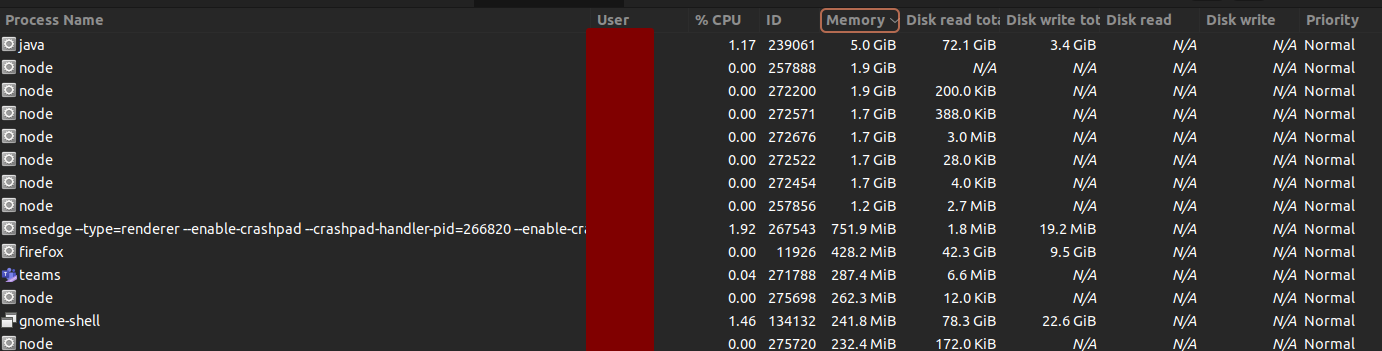
Got 32GB Ram on my notebook
Dump1: https://pastebin.com/09ExwVXc
Dump2: https://pastebin.com/R3AXDLH2
Dump3: https://pastebin.com/QFAXVXz6
IDEA.log: https://pastebin.com/tkvtWej7
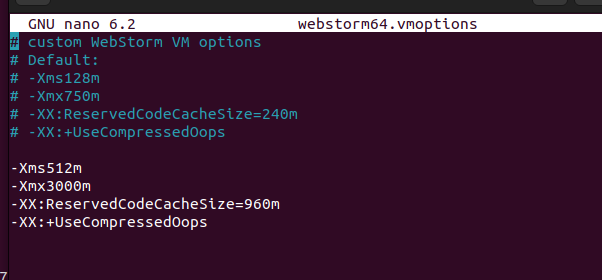
I tried playing around with the config for the Heap, but this seem to have 0 Effect on Ubuntu sadly.
I add some logs from the Freeze since i checked the syslog now permanent and seen there some logs beeing reported.

请先登录再写评论。
could you please capture a memory snapshot using the "Memory Leak or High Memory Consumption" section of this article: https://intellij-support.jetbrains.com/hc/en-us/articles/207241235-Reporting-performance-problems when the IDE memory usage is high and share it in a youtrack ticket (https://youtrack.jetbrains.com/issues/WEB) along with the log folder content zipped? You can enable the memory indicator in the status bar, in the bottom of the application frame (right-click the status bar to enable it) to track the memory usage.
Ok thanks, i created an issue there, wasn't sure if this is the right place
@Rabusdom did you get any feedback on this? I am experiencing a similar issue
i have the same issue.
angular project, and ws eats arround 3.5-5gb or ram, and spawns additional 3 nodejs processes eating up 5g of ram.
and my 32gb ram is 98% used,
cant even move mouse in chrome.
Could you please capture a memory snapshot using the "Memory Leak or High Memory Consumption" section of this article: https://intellij-support.jetbrains.com/hc/en-us/articles/207241235-Reporting-performance-problems when the IDE memory usage is high and share it in a new youtrack ticket? You can enable the memory indicator in the status bar, in the bottom of the application frame (right-click the status bar to enable it) to track the memory usage.
Note that the memory usage in OS task manager normally differs from Java application memory usage. OS Task Manager is reporting the overall memory used by Java process which consists of Java application heap + JVM resources + whatever else, it's a native OS process vs. Java application running in JVM. See https://intellij-support.jetbrains.com/hc/en-us/articles/360018776919-Understanding-IDE-memory-allocation- for more info
In addition to its own memory usage, the IDE spawns some node.js services as child processes that also use the RAM - for example, when you're working on Typescript project, a TypeScript language server will be launched to provide accurate TS code completion and highlighting. This process can itself take up to 4GB memory. Please check the
nodecommand arguments in task manager to see what script is eating the CPU.