Intellij Idea v2020.3.2 doesn't have "Calculate retained size"
Answered

According to this blog https://blog.jetbrains.com/idea/2020/12/intellij-idea-2020-3/, and document https://www.jetbrains.com/help/idea/analyze-objects-in-the-jvm-heap.html#Analyze_objects_in_the_JVM_heap-8-procedure, we should be able to get retained size of the instances during debugging process.
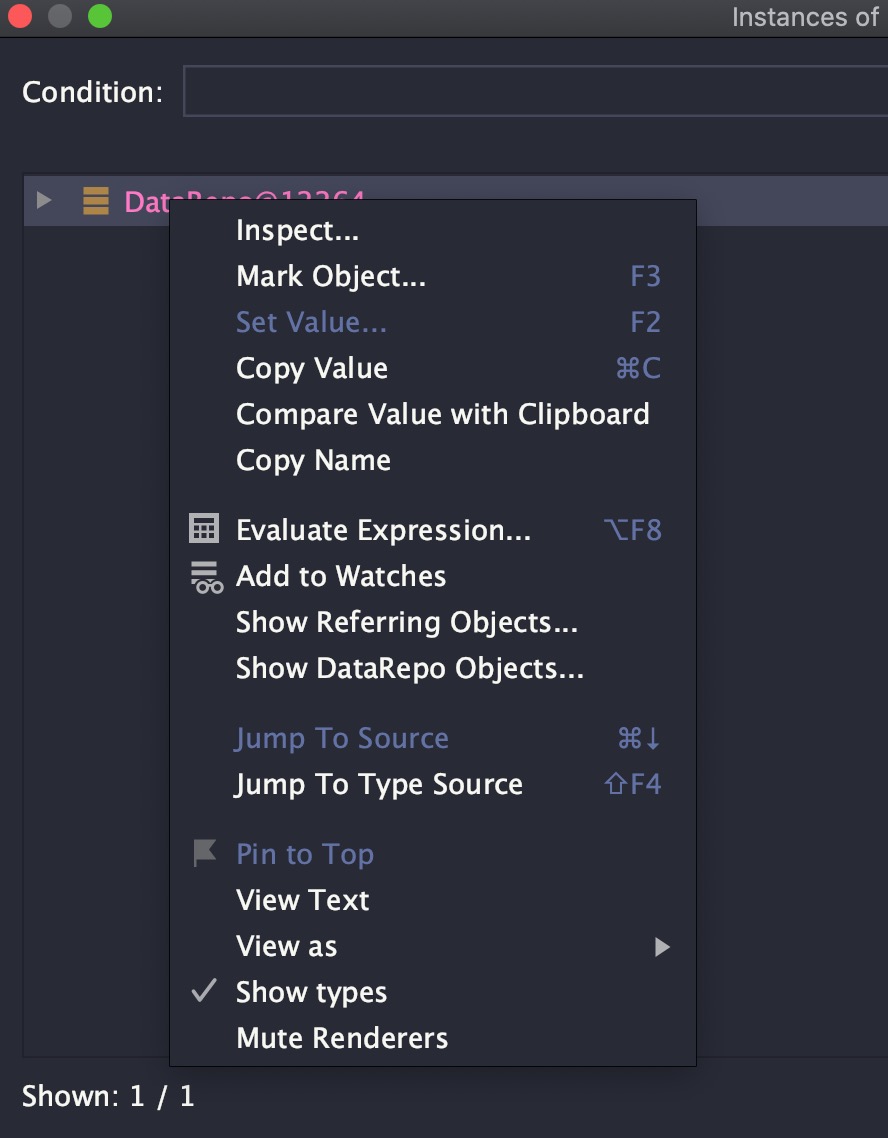
I am using the latest version ultimate 2020.3.2, however the "Calculate retained size" is not available. See below screenshot. What is the best way to get the the retained size? Also is it possible to get the shallow size and deep size?
Thanks
Please sign in to leave a comment.
Please enable Settings (Preferences on macOS) | Build, Execution, Deployment | Debugger | Attach memory agent option.
> Also is it possible to get the shallow size and deep size?
No, it's not a real profiler and currently such information is not provided.
I have activated the `Attach memory agent` option for the debugger, and I still don't see the `Calculate retained size` option when I right-click a class instance in the `Memory` tab.
(MacOS BigSur v11.4, IntelliJ v2021.1.1 Ultimate)
I'm trying to evaluate how big the object is in memory to adjust my Nginx server's `max-body-size` value to accept the request I am observing locally in my integration test.
What type of the app do you debug and which run/debug configuration do you use? Please feel free to file a bug at https://youtrack.jetbrains.com/newIssue?project=IDEA with the steps to reproduce and/or a sample project. Please also provide the logs via Help | Collect Logs and Diagnostic Data.