How-to: Collecting PhpStorm/WebStorm Debug Logs
The instructions below refer to PhpStorm, but the steps for WebStorm are the same.
To enable debug logging, you need to:
1. Open Help | Diagnostic Tools | Debug Log Settings...
2. Add the following lines:
- Issues with PHP: #com.jetbrains.php
- Issues with FTP/FTPS/SFTP deployment/synchronization: #com.jetbrains.plugins.webDeployment
- Issues with SSH/SFTP: #com.intellij.ssh
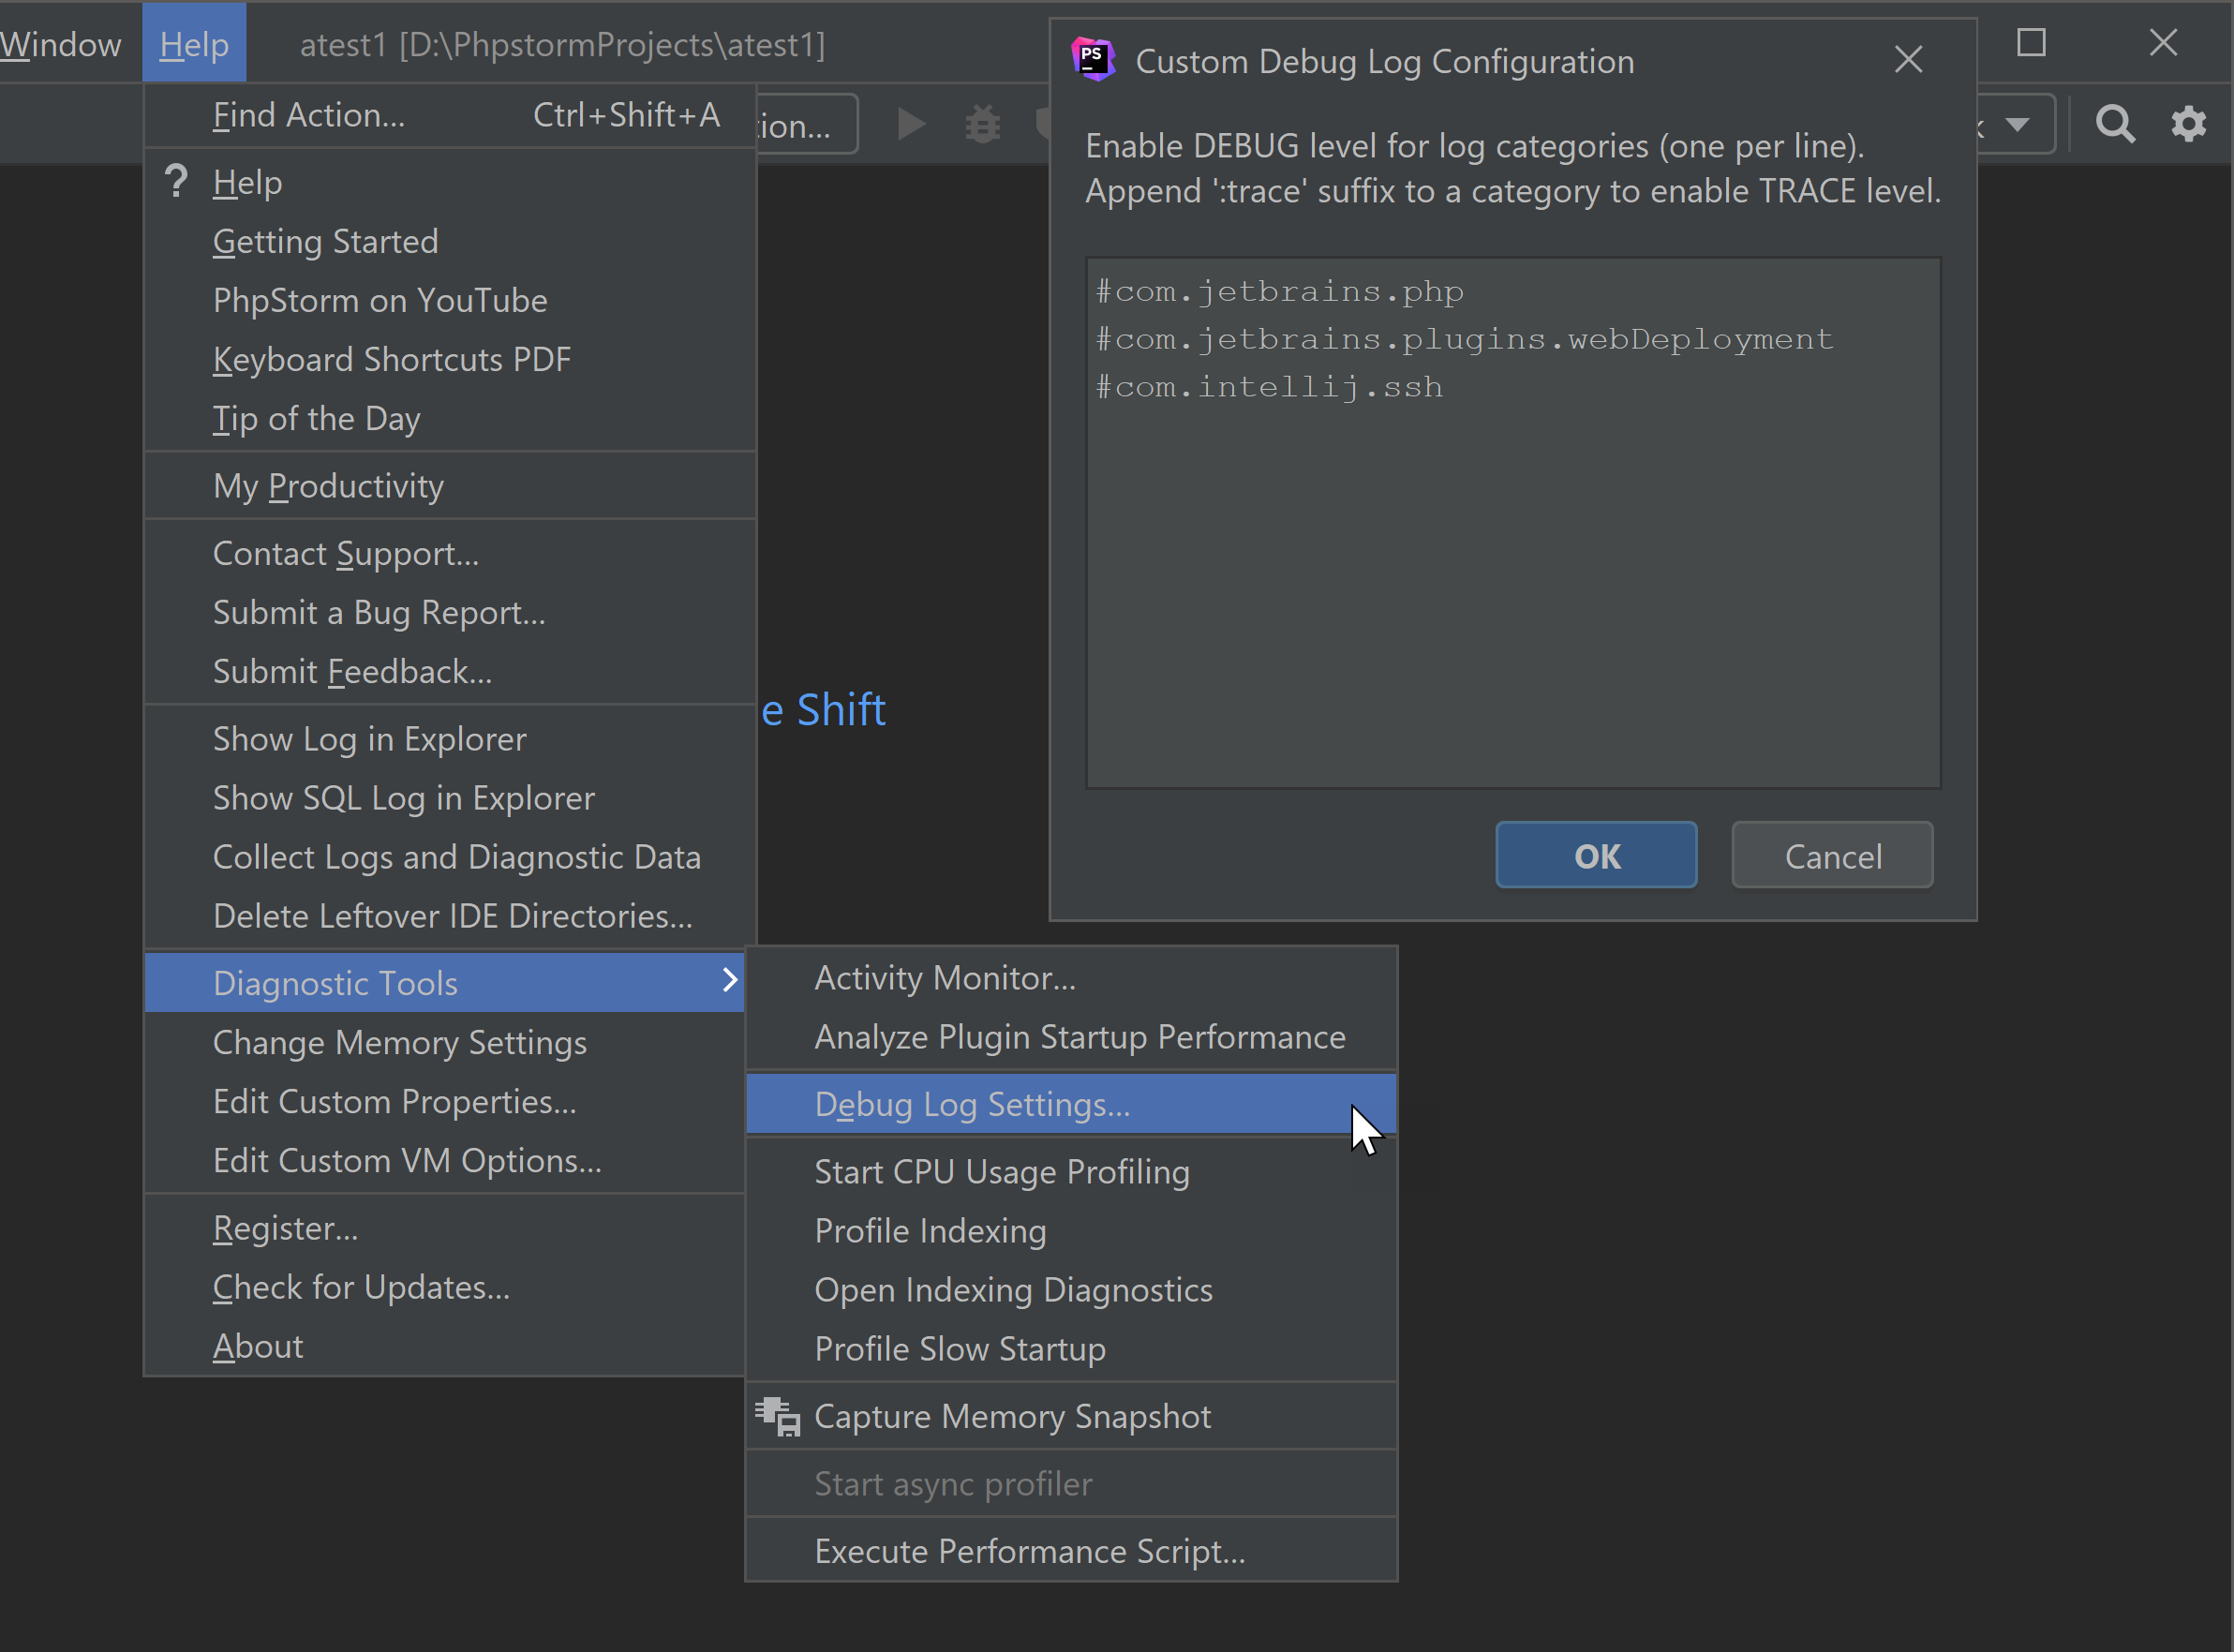
3. Click OK
4. Reproduce the problem.
5. Log files can be found at:
- In PhpStorm/WebStorm:
- Help | Show Log in Explorer/Files/Navigator/Finder
- Help | Collect Logs and Diagnostic Data
- Manually (~ stands for the user home directory and XX for the number of the version):
- Windows: %USERPROFILE%\AppData\Local\JetBrains\PhpStormXXXX.Y\log
- Linux: ~/.cache/JetBrains/PhpStormXXXX.Y/log
- macOS: ~/Library/Logs/JetBrains/PhpStormXXXX.Y
More information about the directories used by IDEs can be found here.
The latest log file is named idea.log, older files names end with a number, i.e. idea.log.1, idea.log.2, etc. In most cases, you need only the latest one.
Please sign in to leave a comment.
So what facilities/plugins/classes are available for debugging? Would you provide a documentation link on the list?
For example, how to figure out what facility is responsible for "Tools > Analyze Xdebug Profiles Snapshop..." tool?
Please contact support for details by submitting a ticket: https://intellij-support.jetbrains.com/hc/en-us/requests/new.
There are thousands of classes that perform logging and it's not feasible to list them all here and to separate under categories. Also, not all the subsystems perform logging.